
- Aster faces declining spot participation while leveraged traders remain positioned against the prevailing trend.
- Most Aster traders hold longs during a downtrend, increasing forced exits and liquidation pressure.
- Binance leads Aster derivatives activity as concentrated futures volume shapes the asset’s price path.
Aster continues to trade under pressure as weakening spot participation and concentrated futures exposure shape its direction. Market data shows a firm downtrend supported by structural positioning imbalances.
Persistent Downtrend and Trader Positioning
Aster as of writing, is trading at $0.9353, marking a 24-hour decline of 2.81%. It also shows a 7-day drop of 5.36%, extending a broader trend that has persisted for nearly two months. During this period, the chart has formed steady lower highs and lower lows.
A post from Ardi (@ArdiNSC) notes that the asset keeps moving lower because leveraged traders continue taking positions against the prevailing direction. Around 68% of perpetual traders hold long positions despite the confirmed decline. This creates conditions where each attempt at recovery faces fresh liquidation pressure.
The Cumulative Net Longs metric adds support to this view. The measure shows a sharp vertical decline, indicating that the recent selling pressure is driven by long capitulation rather than aggressive short exposure. The corresponding short metric remains flat, showing passive participation on the other side.
Volume Distribution and Market Transition
Aster’s volume profile shows a shift from early enthusiasm to declining participation. During early November, daily volumes reached between $4 billion and $5 billion while the price traded above $1.20. That period marked the last major phase of broad activity before the market turned lower.
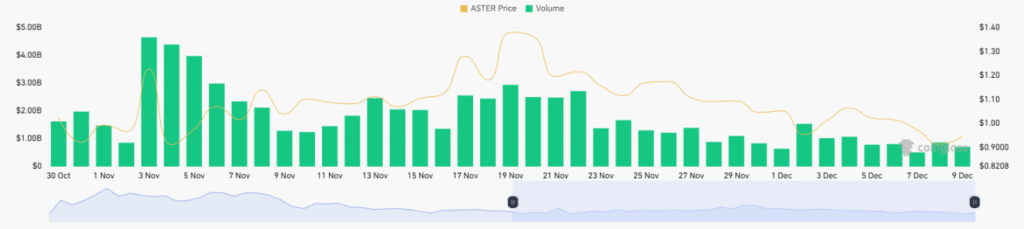
From mid-November, the trend changed as both price and volume compressed. On 13 November, the price reached $1.11 with $2.46 billion in reported volume. That point reflected the early stages of a loss in trader confidence. By early December, daily volumes often ranged between $800 million and $1.4 billion.
This transition shows that spot activity reduced as the asset continued to decline. Participants shifted away from accumulation toward short-term reactive trading, forming a thinner liquidity environment during each downturn.
Derivatives Concentration and Market Structure
Aster’s derivatives landscape is led by Binance. The exchange holds $134.47 million in open interest, $208.57 million in volume, and more than 918,000 futures trades. This level of concentration suggests that shifts in Binance positioning play a decisive role in intraday direction.
Other exchanges such as Bybit, MEXC, Hyperliquid, and Bitget contribute smaller shares of open interest and volume. This confirms a futures-driven structure where a few venues dictate momentum. The high trade counts on Binance and BingX also illustrate elevated short-term activity.
These conditions maintain a feedback cycle where positioning imbalances, rather than natural demand, guide movement. As long as spot volume remains compressed and derivatives exposure stays elevated, Aster continues responding to leveraged flows more than organic trading activity.


