
- AAVE approaches weekly support at $150 as traders monitor reactions on lower timeframes for early direction signals.
- Funding and liquidation data show controlled leverage despite the broader decline toward the key support region.
- A break above $183.5 may shift weekly structure and open a path toward the $220–$230 resistance band.
AAVE enters a decisive market phase as the asset moves closer to a major support level that has shaped previous long-term cycles. Traders now observe liquidity behavior and structure cues to assess the next directional phase.
AAVE Nears Historical Weekly Support Zone
AAVE moves toward the $150 weekly support that has defined several long-term accumulation phases. According to AltCryptoTalk, this zone has repeatedly provided a stable platform for bullish recoveries. The market now tests this area again after a steady multi-week pullback.
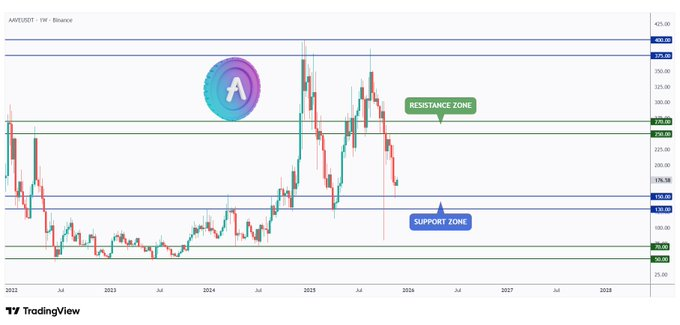
The chart structure shows how this support acted as a demand base during earlier cycles, including the extended consolidation seen in mid-2022. Price action has slowed within this range, showing reduced downside momentum and increased attention from market participants. This creates conditions where lower-timeframe behavior becomes essential for reading early signals.
As of writing, trading behavior reflects a gradual decline from the mid-range cluster near $220–$230. This area has capped upside attempts in recent months and forced rotations back toward support. The rejection from that zone triggered the latest retracement and brought price back into a key decision region.
Break Above $183.5 Needed to Shift Structure
AltCryptoTalk notes that a move above $183.5 is required for buyers to regain structural strength. This level served as the last major high before the recent downturn and represents the origin of the current bearish leg. A reclaim would transition the weekly structure from corrective to neutral.
AAVE as of writing, trades near the lower boundary of its broader range after falling from the $260–$240 area. Without a break above $183.5, the market remains controlled by sellers on higher timeframes. Traders now treat this level as the gateway for any attempt to revisit the upper resistance cluster.
If reclaimed, the chart opens a path toward the $220–$230 resistance band, where previous rally attempts lost strength. This creates a defined structure for traders: defend $150 and overcome $183.5 to confirm a market rotation. Until then, caution persists.
Derivatives and Liquidation Trends Shape Market Expectations
The AAVE OI-Weighted Funding Rate shows mild positive readings through most of the decline. This indicates a market where long positions remained active despite falling prices. Funding has stayed near the neutral line, reflecting controlled leverage and limited directional aggression.
A sharp negative funding spike around October 7 marked a brief surge in short pressure before the rate normalized. Price moved sharply during that period, suggesting a momentary imbalance rather than sustained sentiment change. Derivatives flows then returned to a stable range through November.
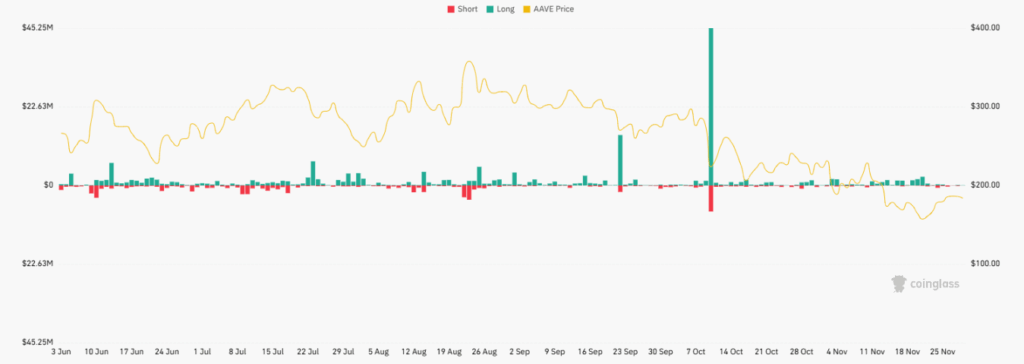
The Aave Total Liquidations Chart adds context, showing muted activity early in the period, followed by increased long liquidations as price weakened. A major liquidation event in early October signaled a broad deleveraging wave. Afterward, liquidation volume declined as traders reduced exposure while price drifted toward $150.


