

Key Insights
- Solana’s price dropped to $98, breaking below $100 for the first time in ten months, continuing a sharp multi-week downtrend.
- Trading and derivatives volume declined significantly, pointing to long position exits instead of aggressive new short positions.
- Despite bearish price action, Solana’s network activity and ETF inflows remained strong, reflecting underlying ecosystem growth.
Solana (SOL) has broken below the key $100 mark for the first time in ten months, trading at $98.03 after a 6.3% daily decline. This level was last seen in April 2025, highlighting a deepening downtrend that has erased nearly 20% of the token’s value over the past week. Over the past 30 days, SOL has shed around 25%, marking its steepest monthly fall since early 2023.
Trading activity in the Solana ecosystem has weakened significantly alongside the price drop. SOL’s 24-hour spot volume has declined by 26% to $7.63 billion, pointing to reduced participation. Derivatives data from CoinGlass shows a 21% fall in total volume and a 5% drop in open interest to $6.15 billion. These shifts suggest traders are closing long positions rather than opening aggressive short bets.
Wider Market Turmoil Amplifies Selling
Crypto markets have faced pressure over the weekend following widespread liquidations. Leveraged positions were flushed out amid thin liquidity, intensifying the downtrend. Additionally, a shift in U.S. monetary policy expectations has emerged after former Fed governor Kevin Warsh was nominated to lead the Federal Reserve. The hawkish nomination weighed on risk assets, including cryptocurrencies. Rising tensions between the U.S. and Iran further contributed to investor caution, pushing capital toward safer instruments.
Despite falling prices, Solana’s network fundamentals remain solid. In January 2026, the network processed over 2.34 billion transactions, outpacing Ethereum, Base, and BNB Chain combined. At the same time, U.S. spot Solana ETFs saw $104 million in inflows, contrasting with outflows from Bitcoin and Ethereum products. These figures indicate ongoing institutional and retail interest despite negative price action.
Technical Indicators Show Bearish Continuation
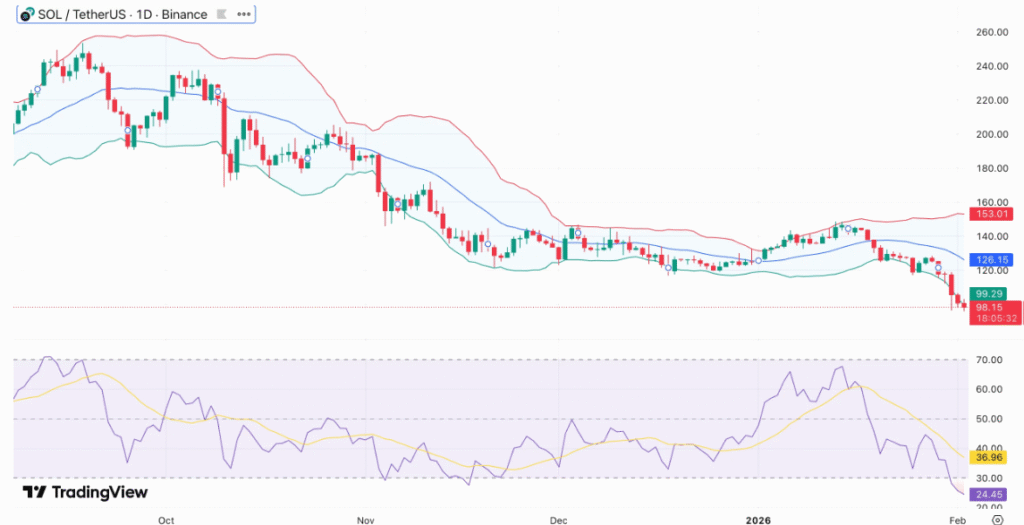
Solana’s daily chart structure remains bearish. The break below $100 confirms a strong downtrend, with lower highs and lows persisting. SOL is trading beneath its declining 20-day and 50-day moving averages. The Bollinger Bands have widened as the price hugs the lower band, showing increased downward momentum. The Relative Strength Index (RSI) at 25 places SOL deep in oversold territory, raising the possibility of short-term bounces but not a confirmed reversal.
Key support lies between $92 and $90, followed by $85 and $80 if selling continues. A sustained recovery above $100 and key moving averages is required to shift the technical outlook in favor of bulls. Until then, the prevailing trend remains negative.


