
Key Insights:
- XRP sentiment has plunged into extreme fear, indicating a potential turning point for price action in the near future.
- Despite negative sentiment, spot accumulation continues, suggesting long-term holders see value at current price levels.
- A descending wedge pattern on the daily chart signals a potential bullish reversal if XRP breaks above $2.00 resistance.
XRP’s price is currently trading near $1.9097, reflecting a sharp decline of 19% from its peak on January 5. This significant drop has caused market sentiment to fall into the “extreme fear” zone, according to Santiment data. As negativity spreads across online platforms, many smaller traders are opting to stay out of the market, with bearish sentiment dominating discussions. However, despite this pessimism, the underlying market dynamics suggest that a reversal may be forming.
The market sentiment surrounding XRP has reached critical levels, as Santiment data shows a rise in negative online chatter. When sentiment turns this bearish, smaller traders typically pull back from buying, leading to less buying pressure. Consequently, a situation arises where selling pressure may ease, creating an environment ripe for a potential reversal. Though the negative sentiment can persist, such extreme fear often signals that the worst of the selling may soon be over, setting the stage for a possible recovery.
Spot Accumulation Contradicts Bearish Sentiment
Exchange flow data from Coinglass reveals that, despite the overall negative sentiment, there has been continuous spot accumulation. A notable $5.38 million in net inflows were recorded on January 23, meaning that a significant amount of XRP is being moved off exchanges and into private wallets. This accumulation is often a sign that long-term holders view the current price levels as attractive, even as retail traders remain fearful. This contrast between market sentiment and actual flows could set the stage for a reversal.
XRP’s derivative market shows a reduction in trading activity, with open interest falling 2.73% to $3.31 billion and trading volume dropping by 40.31%. These metrics suggest that traders are reducing their exposure rather than making new bets on XRP’s direction. Interestingly, options activity has seen a significant uptick, with a 134.60% increase in volume. This suggests that some traders are positioning for volatility, rather than making directional bets, which may be a sign that the market is bracing for price movement.
Descending Wedge Pattern Indicates Bullish Potential
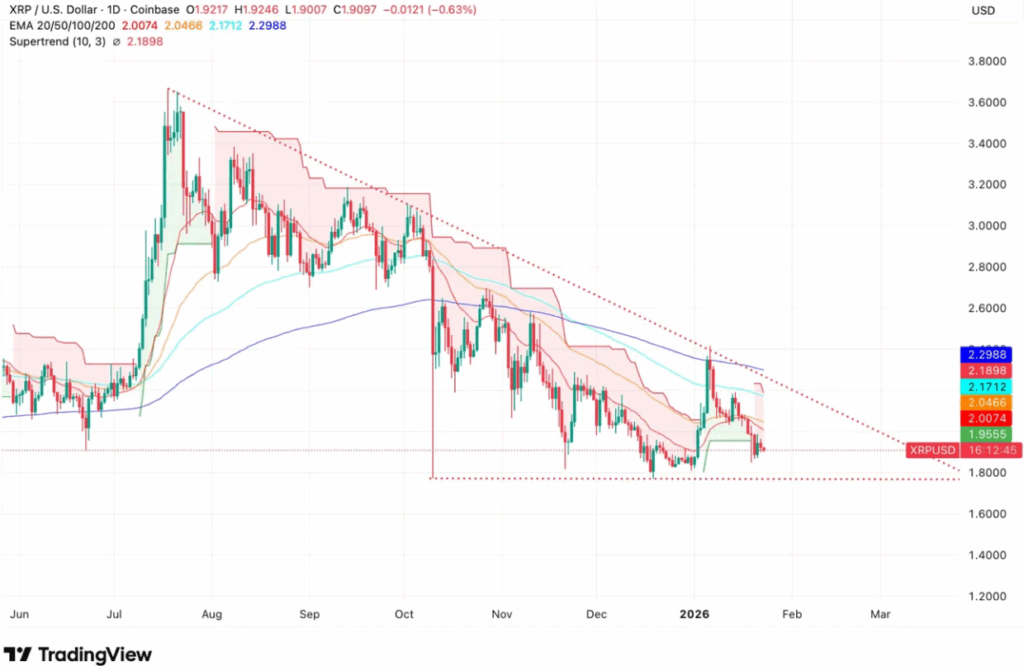
On the daily chart, XRP has formed a descending wedge, a pattern typically associated with bullish reversals. The trendlines within this pattern show converging lower highs and lower lows, which often lead to a breakout to the upside.
If the price breaks the upper trendline, XRP could make its way back toward the $2.20 to $2.30 range. Current resistance levels are near $2.00, while support remains at the $1.80 zone. A move above $2.00 would signal a potential shift toward the upside.


