
Key Insights:
- LUNC’s price surged 11%, driven by a viral moment at Binance Blockchain Week, fueling investor attention.
- $3.5 million in net inflows over two days mark the highest accumulation for LUNC this year.
- LUNC broke above a key trendline, with price approaching crucial resistance at the 200-day EMA for further potential gains.
Terra Classic (LUNC) has seen an impressive 11% surge, bringing its price to $0.0000625. This marks a sharp breakout that has doubled the token’s market value in under 48 hours. The surge follows a combination of factors, including an unexpected surge in spot demand, a significant technical breakout, and a viral moment that pushed LUNC into the spotlight.
The catalyst behind the recent price surge is unorthodox. A viral clip from Binance Blockchain Week showed a well-known reporter wearing a LUNC T-shirt while moderating a session. This seemingly small act ignited significant attention across social media platforms. Though some critics labeled the movement as irrational, market activity suggests that visibility plays a major role in price movement, sometimes overriding fundamental factors.
Record Inflows Highlight Changing Market Dynamics
Coinglass data reveals a massive influx of capital into the LUNC market. Net inflows amounted to $3.53 million on one day, followed by $1.46 million the next. These numbers represent the highest two-day accumulation period of the year. LUNC has spent much of 2025 under persistent negative flows, indicating a lack of confidence among investors. However, this recent reversal suggests that fresh capital is now entering the ecosystem, signaling a shift in market sentiment.
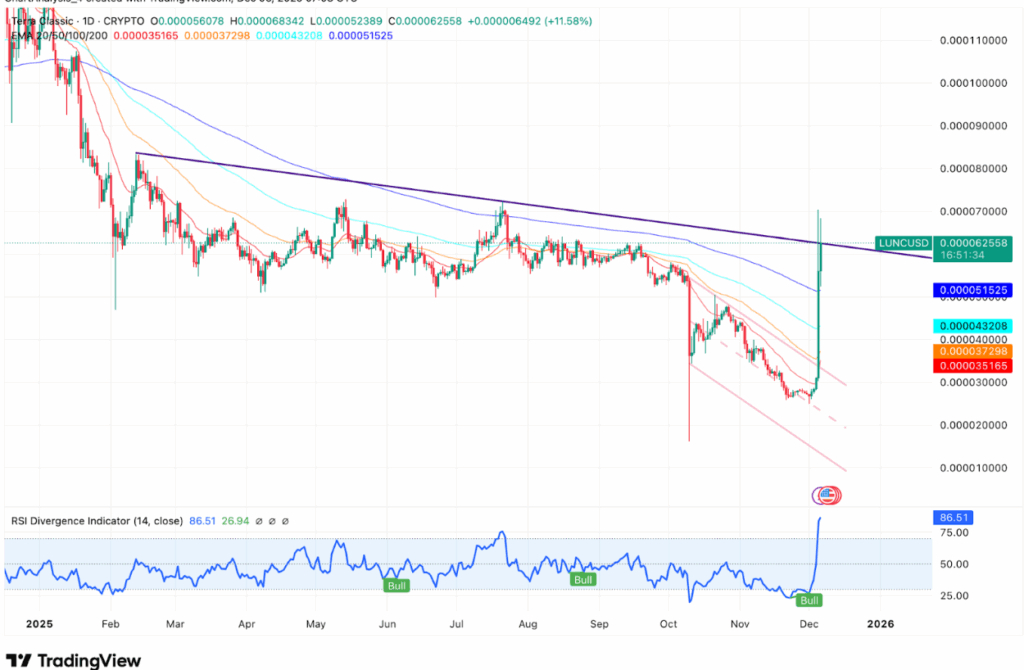
The daily chart for LUNC shows the token breaking through a multi-month descending trendline. This trendline had previously acted as a barrier, rejecting rallies since March. Alongside this breakout, LUNC has surpassed key exponential moving averages (EMAs), now acting as support levels. The token is approaching the 200-day EMA at $0.0000512, a crucial level to maintain for the breakout to be considered a structural shift. If LUNC can hold above this level, it could trigger further upside momentum, but losing it could lead to a quick retracement.
While the price action is undeniably bullish, the Relative Strength Index (RSI) has spiked to 86, signaling overbought conditions. This suggests that the price has significantly outpaced underlying fundamentals and liquidity. Despite the overbought reading, rallies can still continue, but it does heighten the risk of a sharp pullback if buying momentum slows. Traders will be closely monitoring whether the price sustains its momentum or faces a quick reversal.
Short-Term Patterns Suggest Continued Volatility
On the 30-minute chart, LUNC has formed a symmetrical triangle following a sharp upward movement. This is a classic continuation pattern that often precedes a second leg of price action. The price is currently testing the upper boundary of the triangle, and a clean break above $0.0000658 could lead to further gains. Conversely, failure to break this resistance could lead to a retreat back toward support levels around $0.0000542.
For the bullish scenario to play out, LUNC needs to break above $0.0000658 with volume. This could extend the current rally toward the $0.0000800 to $0.0001000 range, as long as the inflows remain positive. However, any sustained close below $0.0000510 would signal exhaustion and may trigger a quick retracement back toward the $0.0000430 zone.


