

- Solana trades near $132 as selling pressure pushes the market toward a deeper support area.
- Persistent spot outflows signal weaker demand as large sellers maintain control of market direction.
- The $124 zone remains a key support level that may define Solana’s next trading phase.
Solana continues to drift toward a major support zone as persistent distribution and weakening momentum shape the current market tone. Price action reflects caution, with traders watching the next support test for short-term market direction.
Market Structure Shows Declining Momentum
Solana is at the time of writing priced at $132.45 after a 24-hour decline of 3.08 percent. The asset has also retreated 3.52 percent over the past week, showing continued pressure within its intraday structure. Recent movement demonstrates a controlled slide from the mid-range as sellers maintain the upper hand.
According to chart projections shared by Ali (@ali_charts), Solana has moved away from a consolidation area that once held near $131–$133. The steady break from the $145–$146 region introduced a sequence of lower highs that signals fading buyer strength. This pattern now guides the market toward the $124 support area.
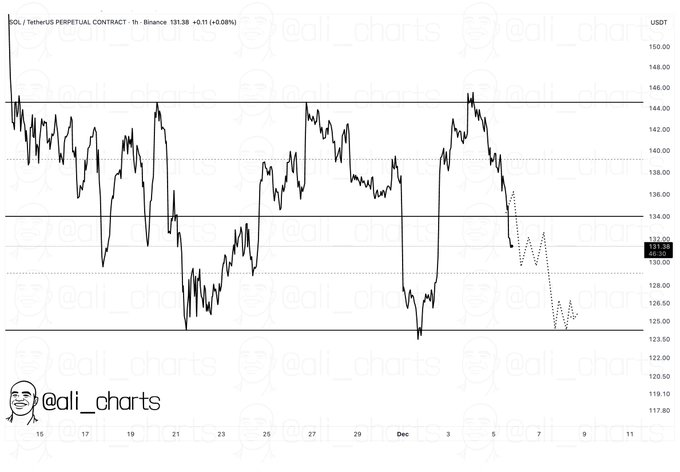
The $124 level aligns with a zone that attracted buyers during previous declines. Past reactions from this area created temporary recoveries, but current momentum suggests a deeper test is possible if the market fails to reclaim $134 in the short term.
Support Zone Holds Market Focus
The descending structure now positions $134 as the main boundary between stability and continued decline. A move above this level may offer temporary relief. However, sustained failure to regain that boundary keeps price action pointed toward the lower range.
The projected path shared in the chart shows a stair-step decline that mirrors current trading behavior. The pattern reflects clear fatigue, with smaller recoveries and sharper downward reactions each time sellers return. These shifts can guide price toward the identified support band.
If Solana reaches the $124 zone, market participants expect either a bounce toward $130–$134 or a deeper move toward $118–$120. Each scenario depends on whether buyers treat the lower band as favorable value after recent outflows.
Spot Netflows Reflect Persistent Distribution
Spot netflow data reveals that selling activity has dominated the second half of the year. Earlier months carried a balanced mix of inflows and outflows, but recent sessions show stronger exit pressure. This adds weight to the decline in price.
Large negative netflows between August and November marked periods where major holders reduced exposure. Outflows near or exceeding $150M appeared frequently and aligned with broader weakness across the chart. These waves limited the sustainability of rallies through the recent decline.
During the latest move toward $132, inflows have not matched earlier periods of strong support. With outflows continuing, Solana remains vulnerable to a further test of lower ranges unless buyers rebuild momentum near key support.


