
- ETH defends the $2,750 support as a weekly hammer form, pointing to firm buyer interest.
- Long-short ratios tilt bullish while short liquidations expand across 12-hour and 24-hour frames.
- Funding stabilizes near neutral after a deep negative spike, hinting at cautious leveraged re-entry.
Ethereum enters a new trading phase as technical levels stabilize and derivatives data shifts toward modest bullish positioning. The broader structure shows buyers defending key zones while leveraged exposure adjusts after recent volatility.
Macro Structure and Price Development
Ethereum shows a developing inverse head and shoulders pattern on the weekly chart. This structure was noted in a detailed update from Donald Dean, who outlined targets of $4,109 and $5,766. Price continues to react near the 50% retracement level at $2,750, which remains an area of steady buy-side interest.

The current weekly hammer candle signals firm absorption at this zone. Buyer engagement has been held after several retests, giving the right shoulder structure more clarity. ETH is trading at $3,216.44, gaining 4.51% in the past 24 hours and 6.37% over the past week.
Two visible range volume shelves, near $2,700–$2,800 and $2,300, present major reference zones. Price currently sits above the upper shelf, reinforcing its role as structural support. A break below this range would risk deeper movement, but buyers continue to maintain control.
Long-Short Positioning and Liquidation Activity
The long-short landscape shows a tilt toward bullish positioning. Binance accounts show a ratio of 1.4845, while OKX remains near 1.27. Top traders lean more aggressively long, with Binance’s position ratio reaching 2.8807. This reflects broader confidence from high-volume participants.
Liquidation activity offers further context. Over the past hour, shorts absorbed most losses, with $3.80M cleared versus $410k in longs. The four-hour window shows a more balanced split, indicating intraday fluctuations remain active.
The largest swings appear in 12-hour and 24-hour periods. Short liquidations reached $61.50M in the 12-hour window and $103.88M in the 24-hour window. These events suggest traders positioned against recent support retests faced rapid reversals as price stabilized.
Funding Rate Behavior and Market Positioning
Ethereum’s OI-weighted funding chart shows sustained positive readings for much of the recent uptrend. Longs paid a premium during rallies toward the $4,000 zone, showing persistent leveraged commitment.
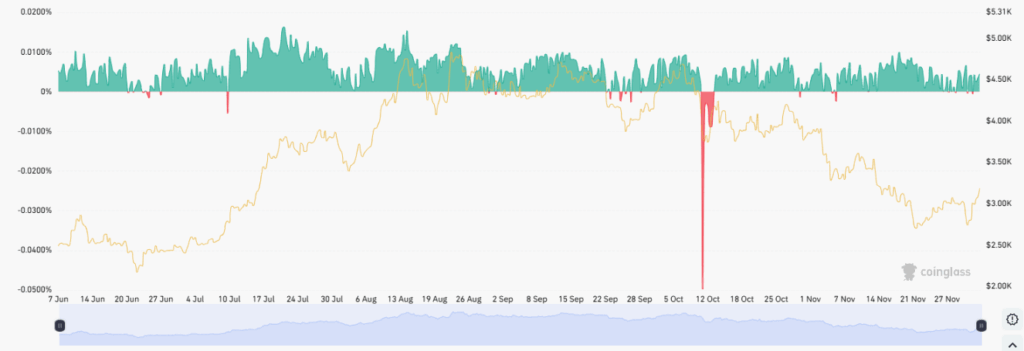
A major negative funding spike emerged in mid-October, reflecting a surge in short exposure. This spike aligned with a sharp price drop, showing aggressive defensive positioning from sellers at the time.
Recent weeks show funding stabilizing near neutral. This shift indicates cautious leveraged re-entry as ETH trades above key support levels. The pattern suggests a market working through a transition from stress to gradual accumulation, setting conditions for a potential advance if support continues to hold.


