
- ZEC liquidity maps show strong downward pull toward a major liquidation cluster near $300.
- Recent tweet notes grinding price action that aligns with a clear liquidity roadmap and thinning support.
- High volume reflects forced liquidations rather than sustainable accumulation or market stabilization.
ZEC continues trading near $317.82 as persistent selling pressure pulls price toward a major liquidation band. Market behavior aligns with liquidity data showing a steady drift into lower clusters.
Liquidity Map Shows Consistent Direction Toward Lower Zones
The liquidity map reveals a thick concentration of liquidation levels just above $300, forming a dominant cluster that attracts current price movement. These dense yellow zones represent leveraged positions set to unwind, creating a gravitational pull toward deeper liquidity. Market flow continues sliding along this gradient.
Analyst Ardi (@ArdiNSC) described ZEC as “heavy for a reason,” noting its direct movement toward the thick yellow band. The post also pointed out that the chart’s vacuum zones leave little structural support above, forcing price toward areas of higher liquidity. This behavior reflects a controlled descent that mirrors the map’s projected path.
Each small rally over recent sessions has failed to gain traction, leaving clear trails of thin liquidity behind. These shallow attempts show limited demand to reverse the trend, keeping attention on the deeper cluster. As long as liquidity concentrates near $300, the map suggests this level remains the natural target.
Liquidation Activity Expands With Price Weakness
The chart tracking short and long liquidations shows intensified activity since early October. Long-liquidation spikes grew larger during brief pullbacks in the earlier rally, signaling aggressive positioning that later shifted into vulnerability. As the trend turned lower, both long and short trades began unwinding with greater frequency.
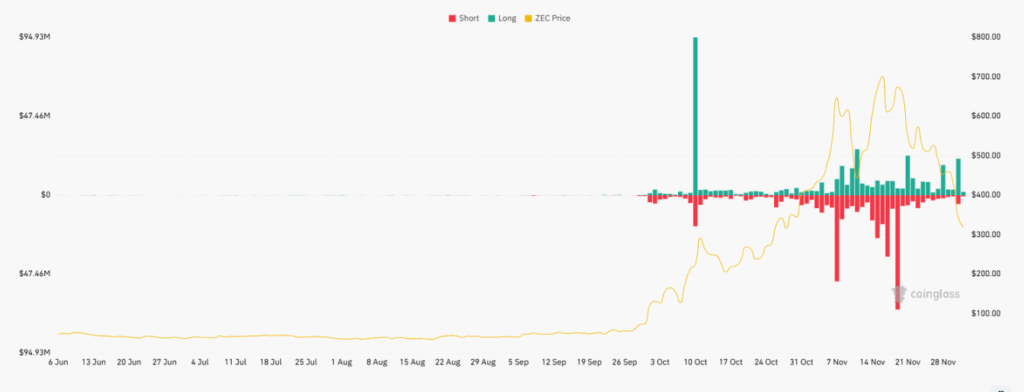
During the November decline from above $700, liquidation bars increased sharply. Many shorts entered late and were forced out during small upward retracements, while long positions continued to be flushed as price made new lows. These alternating long and short liquidations show a reactive market caught in heightened volatility.
The continued rise in liquidation spikes reflects wider participation rather than isolated moves. As leveraged positions unwind, the resulting volatility accelerates price toward the deeper liquidity fields where more orders sit waiting.
Volume Surge Mirrors a Crowded Exit
Trading volume reached roughly $1.20 billion in the last 24 hours, coinciding with a 12.23% daily drop and a weekly decline nearing 38%. This volume profile signals heavy forced participation rather than calm consolidation. The pressure stems from unwound leverage rather than renewed accumulation.
Each downward extension appears tied to the clearing of long positions built during the mid-October to November rally. As stop-loss levels cluster around the key lower band, cascading liquidations continue directing price. The concentration of orders near $300 magnifies this effect.
With shallow support above and a dense liquidation pool below, market structure shows a path that remains oriented toward the lower band. Until the cluster around $300 is fully engaged, upward traction appears limited.


