

- Bitcoin ETF inflows surged past $670M as institutions ramped up BTC exposure.
- Ethereum ETFs posted steady outflows, with investor demand falling sharply.
- The ETHBTC chart shows no trend reversal as ETH lags BTC in price and fund flows.
Bitcoin ETFs saw a sharp resurgence in institutional inflows on May 2, signaling renewed confidence in BTC price momentum. In contrast, Ethereum ETFs continued to bleed capital, with investor sentiment weakening as ETH underperformed against Bitcoin across both price and fund flows.
Bitcoin ETF Inflows Hit $674M Amid Renewed Institutional Demand
Daily net inflows for Bitcoin ETFs soared to $674.91 million on May 2, signaling aggressive institutional positioning. iShares by BlackRock led with 3,636 BTC in new inflows worth $352.17 million, bringing its holdings to 607,685 BTC valued at $58.86 billion. In a report by Lookonchain, total net assets across ten ETFs surged past $113.15 billion.
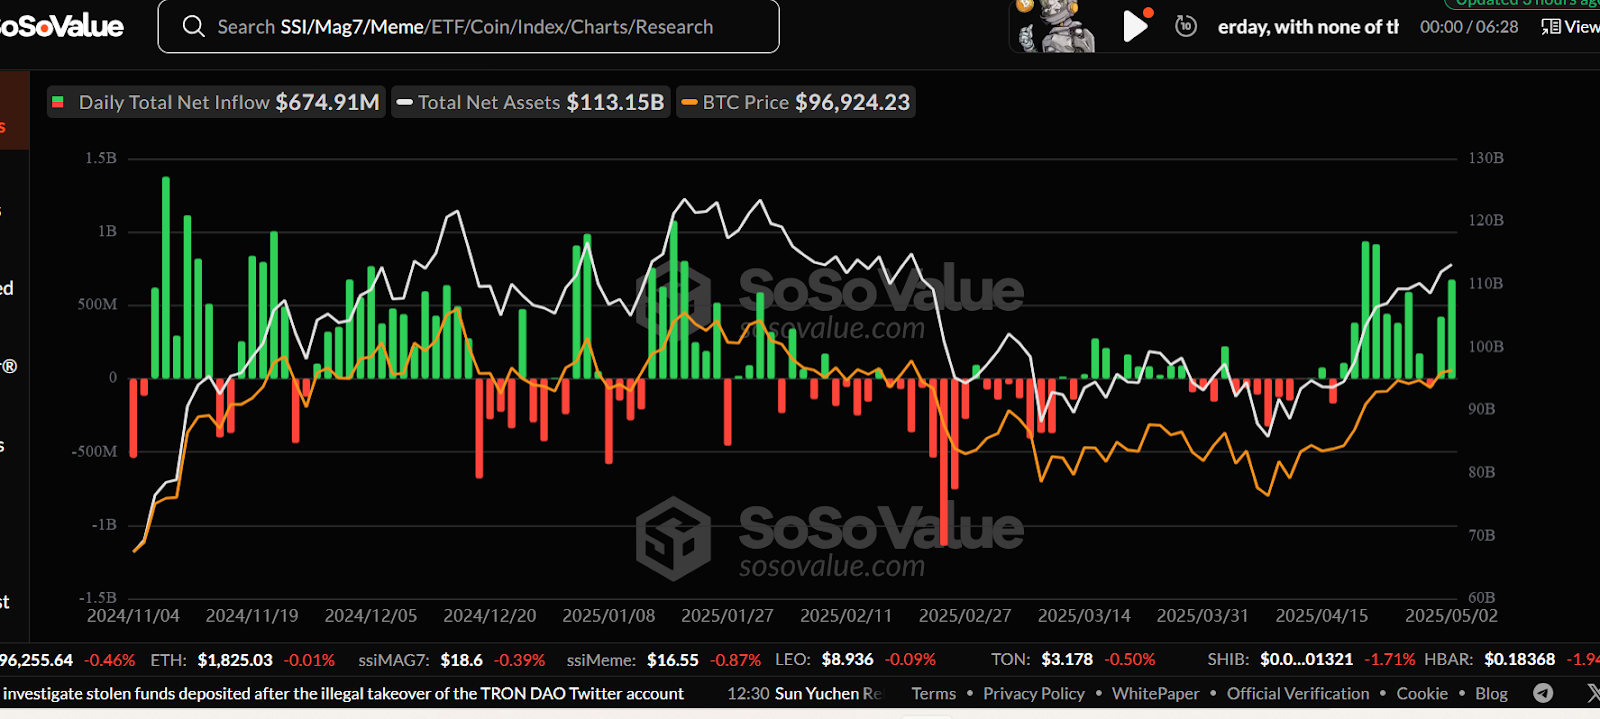
The SoSoValue chart shows a synchronized climb in net assets, ETF inflows, and BTC price since mid-April. Green bars returned consistently above $600 million, with several sessions near $800 million, reversing months of capital outflows. BTC’s price has rebounded to $96,924.23, aligning with renewed inflow strength.
Market conditions have prompted a new wave of strategies aimed at stabilizing BTC exposure through ETF vehicles. The correlation between investor flows, asset totals, and price movements has tightened across the top ten ETFs. These trends highlight growing institutional confidence in Bitcoin’s price trajectory.
Ethereum ETFs Show Outflows, Investor Sentiment Weakens
Ethereum ETFs recorded net outflows of $656,000 on May 2, led by a 4,070 ETH withdrawal from Grayscale ETHE worth $7.47 million. Nine Ethereum ETFs collectively hold 1.14 million ETH, valued at $2.09 billion, but recent data confirms dwindling engagement. According to a report by Lookonchain, total asset value remains under pressure.
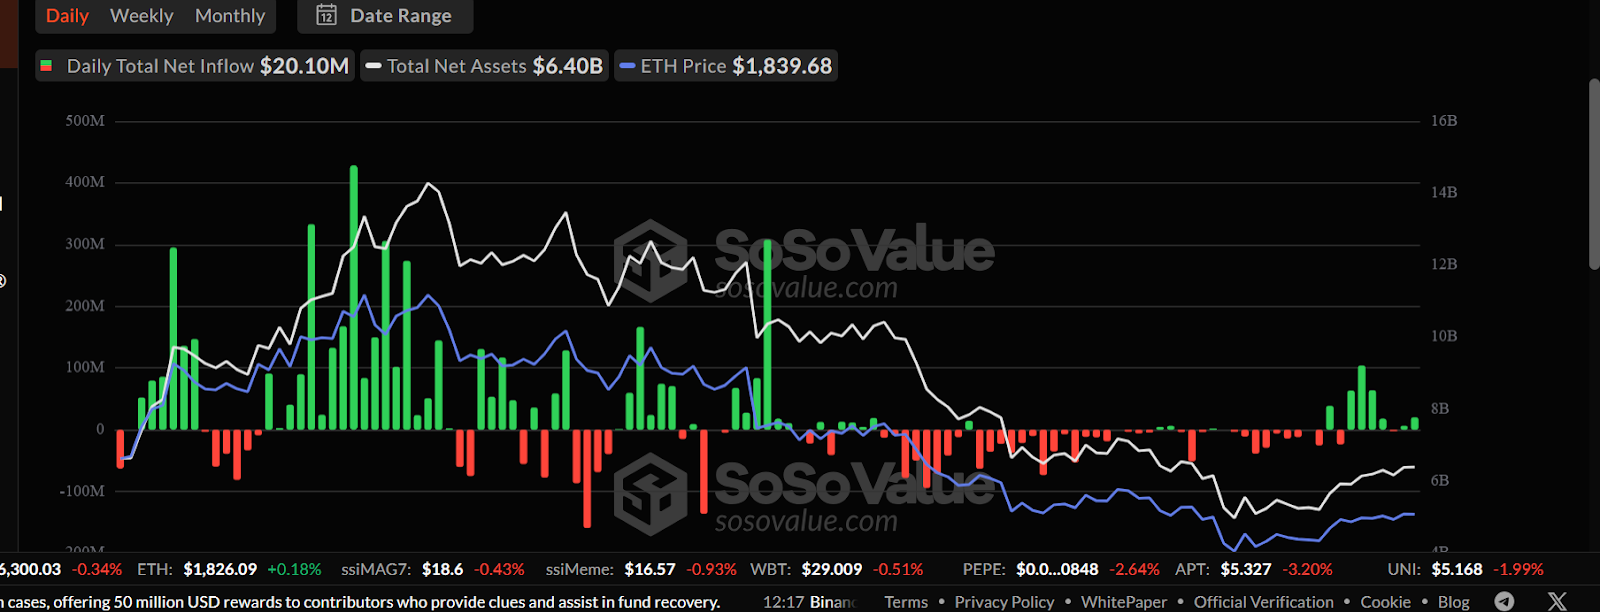
According to SoSoValue, ETH vehicles display declining inflows and shrinking net assets, now down to $6.4 billion from January’s $14 billion peak. Structural weakness has emerged across asset exposure and investor interest, despite recent price stabilization above $1,800. Custody and liquidity plans remain intact, but investor momentum is noticeably lower.

Emerging evidence points toward shifting dynamics in institutional allocations as ETH underperforms BTC both in price action and fund flows. Ethereum’s weaker performance and continued capital flight reflect rising skepticism around short-term upside. Strategic reentry by funds remains limited despite broader market recovery.
ETHBTC Chart Confirms Downtrend, No Bullish Signals in Sight
The ETHBTC 4-hour chart remains structurally bearish, with a persistent pattern of lower highs and lower lows since March. Price action dropped from 0.0575 to under 0.0490, where it now trades in a tight band. Each rally attempt faces sharp rejection near 0.0505, with no signs of upward momentum.
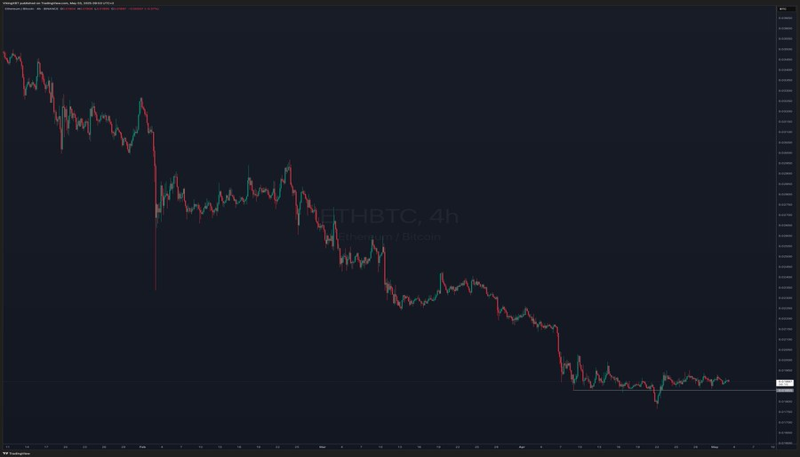
Volume shows steady activity but no directional conviction, keeping the pair locked in a narrow range. The lack of volatility and short-bodied candles suggests indecision and fading interest. Buyers have repeatedly failed to establish control or defend support levels.
Industry analysts have also flagged notable concerns around Ethereum’s weakening correlation to Bitcoin amid ETF divergence. ETH remains suppressed below key resistance zones, with sentiment stagnating among both retail and institutional participants. Unless flows return, ETHBTC may continue its downward slide.


