
- PEPE weakens as the market reacts to soft momentum near a crowded resistance zone.
- Long liquidations rise as leveraged traders face sharp price drawdowns during the decline.
- Sellers regain control as price forms lower highs and distribution signs appear on the chart.
PEPE trades under steady pressure as price action weakens across intraday levels, with sellers controlling momentum and leveraged positions unwinding through the latest sessions.
Resistance Tests Shape Short-Bias Positioning
PEPE approaches a resistance cluster that has shown repeated rejection. UNKNOWN TRADER (@Learnernoearner) shares a limit-short setup as the market tests this supply zone. The entry range at $0.000473–$0.000485 aligns with the recent hesitation near the upper band.
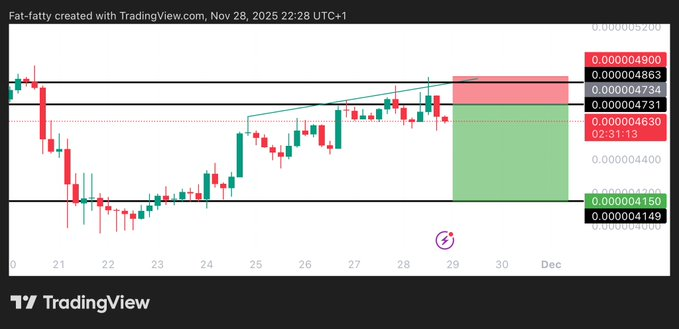
The chart structure between the 22nd and 28th forms a stretched ascending pattern with weaker higher highs. The uneven progression reflects reduced buying commitment as price moves deeper into congestion. Wicks around the $0.00048 region show heavy sell orders absorbing buy attempts.
The suggested stop-loss at $0.0004928 stands above the wick region where structure would shift. A move beyond this level would nullify the compression phase. The target at $0.000415 corresponds with the last notable accumulation block and previous consolidation.
PEPE Price Extends Downtrend as Momentum Fades
PEPE trades near $0.000055 on the 24-hour chart, showing a sharp early spike followed by steady decline. The move forms a blow-off pattern where initial enthusiasm fades. Selling increases as traders offload positions into weakening liquidity.
Intraday rebounds remain brief and shallow. The formation of lower highs confirms dominant overhead pressure. Buyers attempt recoveries but each move loses strength as price continues slipping. Market cap near $1.91B moves lower by more than 4% as price contracts.
Volume rises by over 18% while price falls. These conditions often accompany distribution phases where traders exit positions. By the end of the session, PEPE holds within a compressed downward channel. Selling retains control as the token struggles to reclaim support.
Liquidations Increase as Leveraged Traders Unwind
The PEPE Total Liquidations Chart records broader market stress. Long liquidations dominate early, reflecting traders hit by sudden dips. Each downward break flushes overextended positions as price weakens.
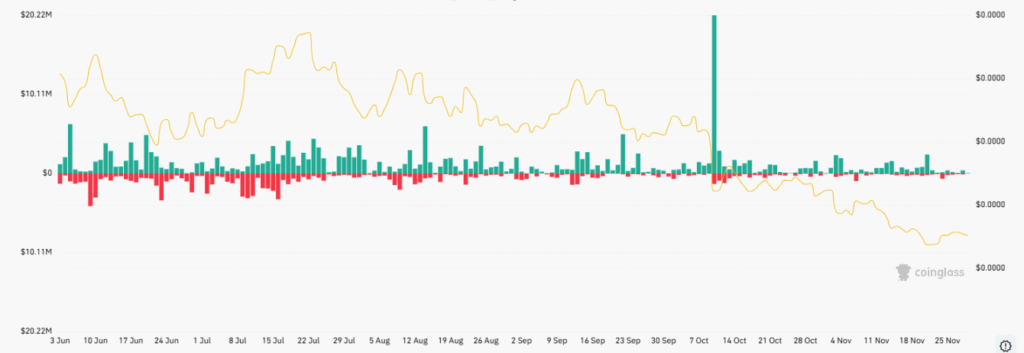
A major long liquidation spike appears near the mid-right of the chart. This event signals a washout during a rapid drop. The magnitude suggests broad deleveraging as traders exit high-risk positions. After this move, liquidation activity declines.
Despite fewer liquidations later, price continues its downward path. Short liquidations remain small, showing bears remain well-positioned. The market displays a sustained downward bias as leveraged participation cools and momentum remains soft.


