
Key Insights
- Hedera price rebounds to $0.148 after testing the $0.125 demand zone, but stays capped below its descending trendline resistance.
- ETF holdings for HBAR rose to 421 million units, signaling continued institutional confidence despite bearish technical indicators.
- Consecutive inflows over three sessions suggest reduced selling pressure and improving sentiment in short-term Hedera price action.
Hedera (HBAR) moved higher to trade around $0.148 after a strong bounce from the $0.125 demand zone. The recovery followed sustained selling pressure throughout the quarter. However, despite the recent upside, the broader technical outlook remains bearish as HBAR continues to trade under a dominant descending trendline that has blocked every rally since September.
Short-term momentum lifted after the rebound, but key resistance levels remain intact. The 20-day exponential moving average (EMA) around $0.155 has repeatedly capped upward moves. HBAR has also failed to reclaim the 50-day and 100-day EMAs, positioned near $0.174 and $0.189 respectively. These moving averages are aligned with the prevailing downtrend and continue to exert pressure on the asset.
Technical Signals Remain Bearish
The Supertrend indicator remains red, signaling the absence of a higher timeframe trend reversal. Recent candles show price compressing under the descending trendline, rather than breaking through it. Previous rallies have consistently stalled at this level, and current behavior appears to follow the same pattern.
Recent data from FinancialPress confirms that institutional demand has picked up. Canary Capital’s HBR Hedera ETF expanded its holdings on November 23, bringing the total to 421.47 million HBAR, equivalent to $54.86 million or around 0.84 percent of Hedera’s supply. The steady increase in ETF accumulation suggests growing investor confidence despite the broader market weakness.
Spot Inflows Reduce Selling Pressure
Data from Coinglass shows HBAR recorded three straight days of positive net flows, including a $71,000 inflow on November 24. This marks the first consistent buying streak in weeks and follows heavy distribution throughout the quarter. The return of capital into HBAR is helping to stabilize price action around the $0.125 support.
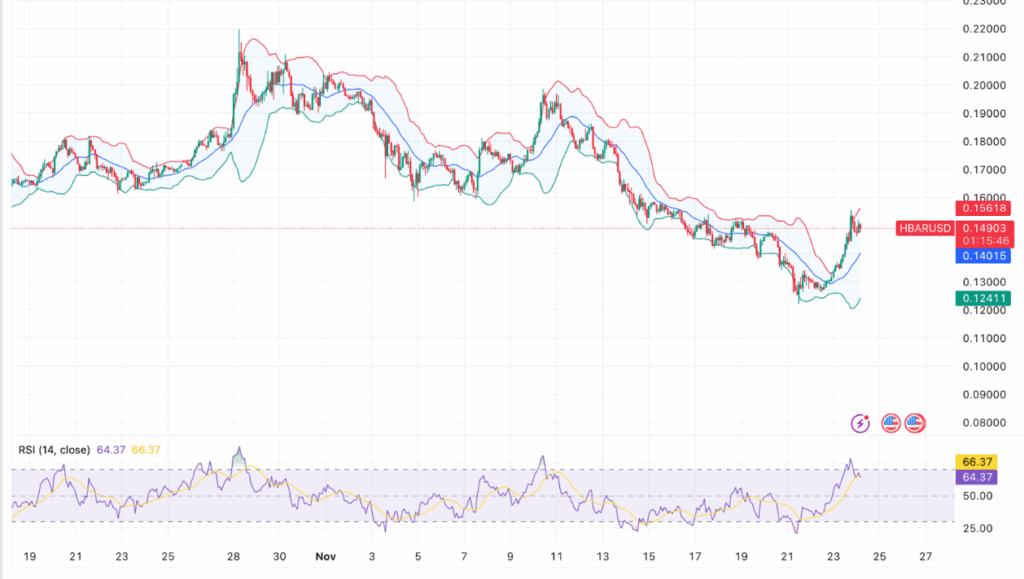
On the 2-hour chart, HBAR shows a clear recovery from $0.125, confirmed by a breakout from a Bollinger Band squeeze. Price touched $0.156 before consolidating around $0.149. The Relative Strength Index (RSI) is now near 66, indicating slowing momentum and possible profit-taking.
For the short-term rally to gain strength, HBAR needs a decisive break above $0.155. A close beyond this level could lead to a test of the 50-day EMA near $0.174. However, failure to clear the trendline risks a drop toward $0.140, with deeper support near $0.125.


