

Key Insights
- Chainlink moved to its weakest level since June as traders monitored a major support zone while ETF plans created fresh attention in the market.
- Exchange balances fell sharply, and reserves increased, signaling steady investor behavior during a period of consistent selling pressure across the broader market.
- Technical indicators pointed to further weakness as LINK traded near its neckline while analysts tracked resistance that could shift the trend.
Chainlink continued to face strong pressure as the token dropped for a fourth week and moved toward an important support level. LINK traded near twelve dollars, marking its lowest point since June and showing a decline of fifty-five percent from its yearly peak. Moreover, the fall came during a period of stable fundamentals on the network.
Traders followed new developments as expectations grew that Grayscale could introduce the GLINK exchange-traded fund next week. Analyst Eric Balchunas noted that such a listing may draw interest from U.S. investors and could influence market activity. Additionally, records from the Depository Trust and Clearing Corporation showed signs of a possible Chainlink product from Bitwise.
Exchange Balances Continue Dropping
Data from Nansen indicated that LINK supply on exchanges dropped to two hundred thirteen million tokens after reaching three hundred million last month. This decline suggested that investors kept their holdings away from exchanges. Besides, this shift hinted at stable investor behavior during the market downturn.
Chainlink reserves continued to increase as totals rose to 884,674 tokens worth about eleven million dollars. The network added more than 81,000 tokens on November twenty from on-chain and off-chain fee flows. Moreover, the steady growth highlighted continued activity within Chainlink’s services.
Technical Signals Show Weakness
Analysts observed a head and shoulders pattern forming on the weekly chart while LINK hovered around the neckline. A drop below this line could open a path toward the ten-dollar level. Furthermore, the relative strength index continued to trend lower and stayed above the oversold reading of thirty.
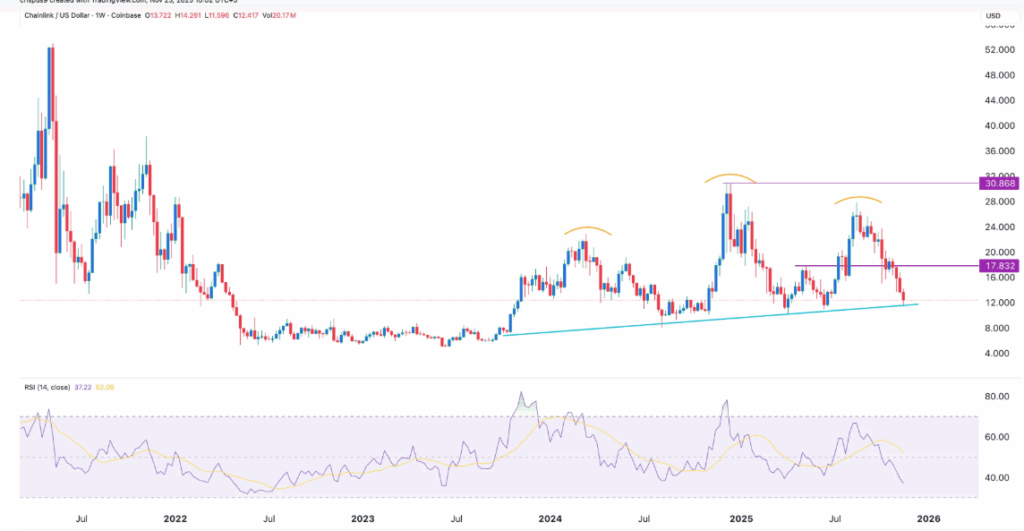
LINK traded under major moving averages and stayed below the Supertrend indicator. These readings reflected a period of consistent selling pressure across the market. Consequently, traders monitored these signals as they assessed whether the pattern could break and extend the decline.
Industry Growth Supports Activity
The real-world asset tokenization sector grew 1.47% in the last month and reached more than 35.6 billion dollars, according to RWA data. Chainlink benefited from this rise because it serves as the leading oracle provider for several platforms. The broader expansion continued to support activity across Chainlink services.
Analysts pointed to 17.83 dollars as the level that could challenge the bearish structure. This price marked the strongest point reached in mid-May and remained a central marker for traders. Market participants continued to watch for signs of recovery while LINK traded near a critical support region.


