

- Cardano ADA trades near a multi-month support zone after repeated tests in 2025, creating a narrow price range watched by market participants.
- Multi-year charts show ADA fluctuating inside major support and resistance bands, with current candles resting in a key 0.44–0.50 trading zone.
- Market cap data from November 11–17 reflects steady selling pressure, forming lower highs and lows while showing early signs of stabilization attempts.
Cardano ADA is approaching a critical trading area as recent market activity shows price pressure testing multi-month support zones and reflecting growing uncertainty among market participants.
Support Structure Under Pressure
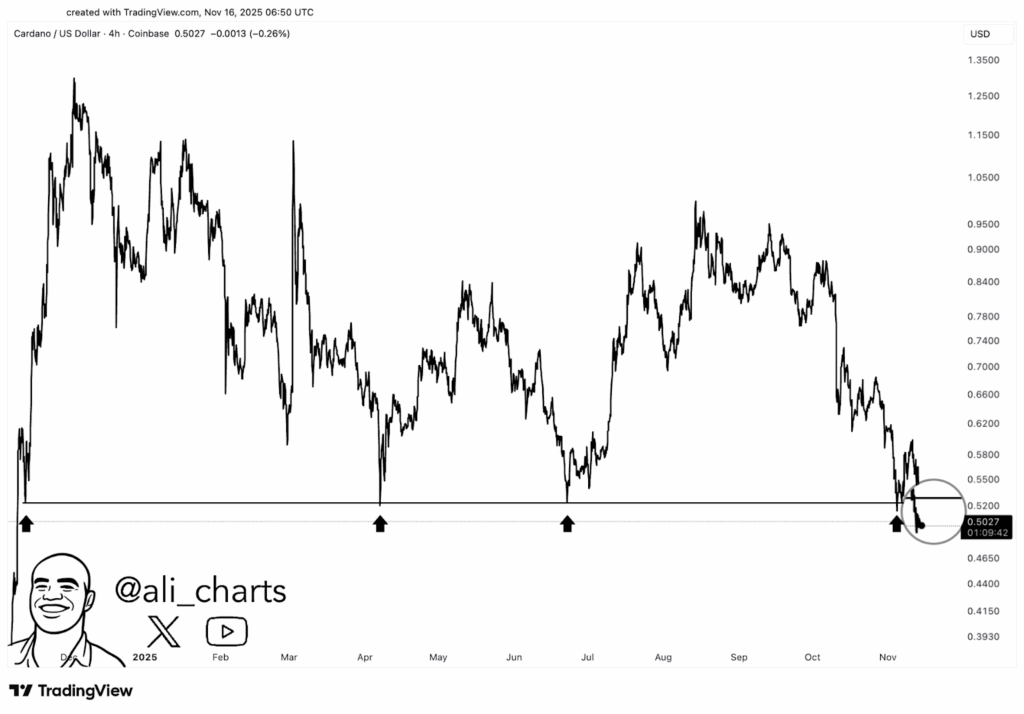
Analyst Ali_charts described price action pressing against a key support level that has held through 2025. Each previous test produced rebounds, yet the latest move shows candles dipping below the boundary before returning to the range.
Market behavior around this area suggests buyers and sellers are locked in a tight contest. The circled region in the shared chart shows compression forming directly above the line. This pattern often appears ahead of larger swings as orders accumulate on both sides.
If sellers gain control, the structure could open room for a deeper move toward lower bands that served as historical bases. However, a firm reaction from buyers would maintain the broader pattern that has shaped Cardano ADA throughout the year.
Multi-Year Technical Framework
A separate multi-year chart shows Cardano ADA trading inside well-defined ranges.These levels functioned as accumulation bases during past cycles, often appearing before extended advances.
Holding above 0.44–0.50 zone could indicate early stabilization, though price continues to form lower highs. This behavior points to waning strength from buyers trying to protect higher ground.
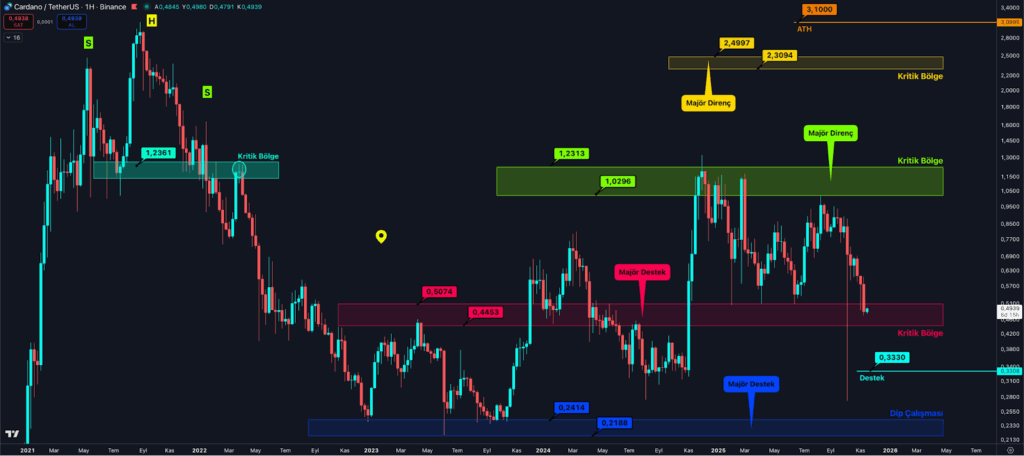
Further above, the green band between 1.03–1.23 remains an area where Cardano ADA previously met heavy resistance. A move through that corridor would require sustained momentum, while the yellow area near 2.30–2.50 stands as the final resistance layer before the historical peak near 3.10.
Market Cap Decline Adds Context
A third chart captures a steady decline in Cardano ADA’s market cap from November 11 to November 17. The structure shows lower highs and lower lows, reflecting persistent pressure throughout the week.
A deeper drop on November 15–16 pushed the market cap toward the 17B range. This represented the lowest point of the sequence and suggested that confidence had thinned during the decline. Yet, a small rebound on November 17 offered early signs of stabilization after several days of stress.
Volume remained steady throughout the chart, showing the move was guided by consistent selling rather than abrupt surges. This broader backdrop adds context to current support tests visible on the price charts for Cardano ADA.


