
- Solana consolidates between $180 support and $210 resistance, suggesting accumulation after a strong bullish phase.
- Long/short ratios above 3.0 on Binance reflect market optimism and growing interest among both retail and top traders.
- A sustained breakout above $210 could propel Solana toward the $220–$225 range if the current structure holds firm.
Solana shows signs of structural resilience as traders assess its current consolidation pattern within defined support and resistance levels. The asset’s latest data indicates stabilization following a strong rally earlier this month, suggesting the market may be preparing for its next directional move.
Solana Shows Market Stability After Pullback
Solana is, as of writing, in a phase of consolidation after a sharp upward trend at the beginning of the previous month. The asset moves in a specific range and the players monitor closely the market behavior to confirm break-out. Despite minor intraday volatility, structural data and trader positioning indicate continued confidence in Solana’s broader trend.
The chart from BitGuru captures Solana’s 4-hour price action on Binance, showing alternating phases of strength, correction, and accumulation. During the “BULLISH BEAUTY” phase, Solana advanced rapidly, reaching a local peak above $220 before entering a retracement period. The correction formed a series of lower highs and lower lows, marking a short-term decline that appeared orderly rather than disruptive.
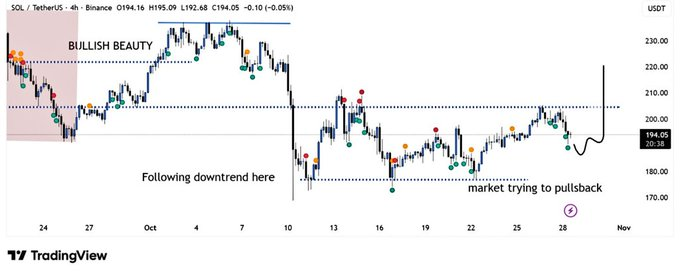
After this decline, the price established support near $180 while facing resistance around the $200–$210 band. This horizontal range represents the accumulation zone where traders are gradually rebuilding long positions. Such behavior often precedes directional expansion, especially when volume and sentiment align toward an upward continuation.
Technical Readings Reflect Mixed Sentiment
Recent performance indicators show Solana down by 1.29% over four hours and 1.49% in 24 hours, suggesting short-term cooling. But the broader view is favorable, with a 7-day return of 6.43% and strong quarterly return of 11.20% over 90 days. Solana has risen 31% over the last 180 days and is up 4.40% year-to-date.
The combination of weak short-term declines and impressive medium-term advances is a sign of market consolidation, not weakness. Speculators are observed to rebalance position in preparation for a probable continuation move. Whipsaws inside and outside the $200 mark indicate short-term resistance, to which profit-taking probably dampened future gains in the near term.
Facing even broader digital asset uncertainty, year-over-year growth of 10.95% and year-to-date appreciation of 23.64% are strong.These numbers confirm that Solana continues to attract liquidity, solidifying its status among technically stronger high-cap cryptocurrencies.
Long/Short Data Points to Bullish Positioning
Market positioning data supports the view of ongoing optimism. On Binance, Solana’s long/short ratio (accounts) stands at 3.0388, meaning three long positions exist for every short. Among the top traders, the long/short ratio reaches 3.4366, showing market experts anticipate movement higher as soon as consolidation is complete.
Similarly, OKX posts a ratio of 2.43, with strong but hesitant bullish sentiment on the platforms. Such levels affirm that institutional and retail traders alike remain hopeful on Solana’s short-term prospects.
Analysts note that if Solana remains in the neighborhood of $195 and moves past resistance at $210, a breakout to $220–$225 is possible. On the other hand, any decline lower than the $180 will lengthen the consolidation. In the meantime, the market is still in the accumulation stage, which is waiting for a definite catalyst to affirm renewed enthusiasm towards the upside.


