
- The S&P 500 chart suggests a terminal fifth wave, signaling possible exhaustion in a multi-decade bull market cycle.
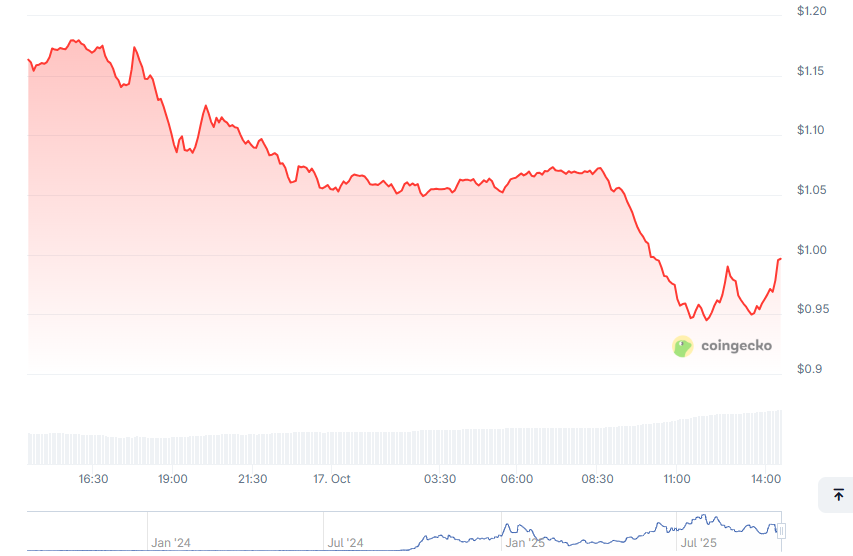
- SPX token trades near $1.00 after a 13.8% drop, mirroring equity market weakness and investor risk aversion.
- Long traders dominate major exchanges, yet rising liquidations show growing market caution and deleveraging.
The S&P 500’s long-term Elliott Wave chart indicates a maturing uptrend, while the SPX token’s synchronized declines across major exchanges suggest investors are reducing exposure amid growing uncertainty in both traditional and digital equity-linked markets.

Long-Term Market Structure Signals a Maturing Cycle
The Elliott Wave framework mapped on the S&P 500 chart shared by analysts CredibleCrypto. Outlines a five-wave impulsive sequence beginning after the Great Depression, each phase reflecting a collective rhythm of optimism and contraction. The first recovery was Wave (1) and then there was corrective Wave (2) in the middle of the 20th century challenges of the cyclical.
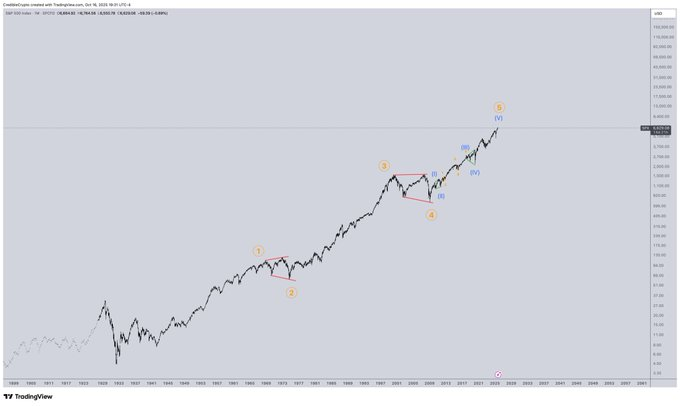
The wave (3) has been the long-term economic growth of the late 20th century that has been fueled by globalization, industrial development, and investor confidence. The period exhibited a sharp upward trend which is in line with investor euphoria. The next Wave (4) was of the early 2000s and 2008 crisis with a wide corrective consolidation that dampened excessive speculation.
Currently, Wave (5) reflects the post-2008 expansion characterized by aggressive liquidity policies, technological disruption, and sustained corporate growth. The pattern has become parabolic — a structural feature often linked to terminal market stages. The chart’s compression of peaks suggests momentum fatigue as the broader equity cycle nears maturity.
SPX Token Declines Reflect Broader Risk Sentiment
The SPX token that tracks wider equity sentiment slipped dramatically by 14.3% per day to trade at around $0.9996. It dropped off a 24-hour peak of $1.18, briefly settling around 0.95 and then recovered to parity. The weak volume is an indication of few buying capabilities and hesitation among the traders despite recovery efforts.
The market capitalization and fully diluted valuation of the token are almost identical, at $918 million, to validate the complete circulation of tokens of approximately 930 million units. This full float will diminish scarcity and build on sensitivity to liquidity changes and sentiment-based swings, particularly during times of greater equity volatility.
Technical readings indicate that there have been regular low highs, and lows within intradays, which supports the short term bearish bias. The resistance is around $1.05-$1.10 with $0.94 as the tentative support. Inability to maintain above parity would invite further downside pressure whereas recovery needs more trading participation.
Exchange Metrics Show Volatility and Divergent Positioning
Across major exchanges, SPX6900 data reveals synchronized declines and rising activity. Binance has a trading volume of $82.48 million, and an increment of 45.24% throughout the downturn. Bybit comes next with $37.12 million, an increase of 33.44%, indicating greater volatility, as traders rearrange portfolios.
Long/short ratios show mixed sentiment. On Binance, the ratio is 0.9861, slightly favoring short positions, while top traders maintain a long bias with 1.3928. OKX’s ratio of 1.5 further suggests that professional traders anticipate recovery despite short-term weakness. This divergence indicates differing expectations between institutional and retail participants.
Data liquidation highlights market stress. In 24 hours total liquidations were over $578,000, of which was $436,000. This implies giving up by over-leveraged traders as prices plunged down. Still, consistent accumulation near the $1.00 level shows efforts to stabilize the market as liquidity consolidates after rapid deleveraging.


