
- Stellar forms a bullish inverse head and shoulders with neckline resistance near $0.42.
- A confirmed breakout could push XLM toward $0.80–$1.00 as projected by technical setups.
- Failure to maintain $0.30 support risks invalidating the pattern and triggering a deeper retracement.
XLM trades at a critical level as its chart is forming a bullish reversal structure.The cryptocurrency’s technical framework suggests that maintaining strength above $0.30 may define its next major price direction.
Technical Setup Points to Emerging Reversal Pattern
The recent chart shared by market analyst Ali (@ali_charts) outlines an emerging bullish structure for Stellar (XLM/USDT). The formation resembles a classic inverse head and shoulders pattern, a model often linked with trend reversals in extended downtrends. This structure reflects a gradual shift in market sentiment from distribution to renewed accumulation.
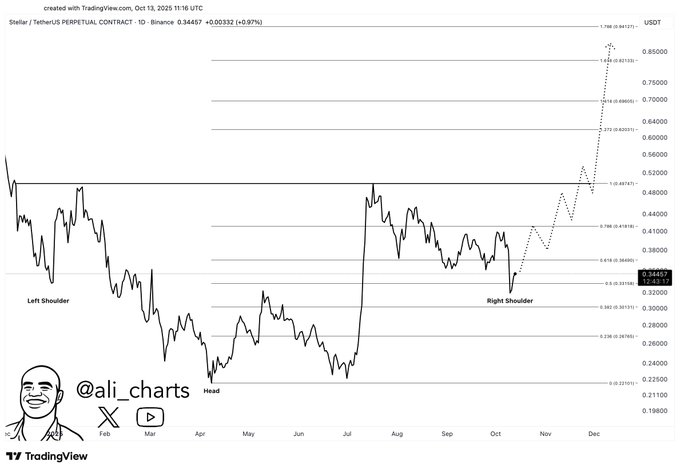
The left shoulder shows an early recovery phase after a decline, while the head represents a deeper capitulation low where selling pressure peaked. As prices rebound from that trough, buyers appear to regain control, forming the base of a potential reversal. The right shoulder, forming between $0.30 and $0.35, now completes this technical setup.
The neckline around $0.42 still stands as the critical resistance area. A daily close above this level that is maintained for a considerable period would be a validation of the reversal, pointing to an alteration in medium-term momentum. Based on pattern projection, the resulting upside could target between $0.80 and $1.00 — aligning closely with the levels projected by Ali.
Fibonacci Confluence and Market Structure
Fibonacci extension levels which indicate probable areas of resistance support the bullish framework. The $0.618 extension is positioned at approximately $0.48, and the $1.0 level is positioned at approximately $0.65, and these two provide the second challenge to the traders who hope to see a lasting recovery. Breach of both zones would reveal the $1.618 extension at $0.85 to complete the intended rally pattern.
Nevertheless, the legitimacy of such a perspective lies in the power of $0.30 – now serving as a structural support. When this level is persistent even amid the near-term volatility, the chart will be in its bullish set up. On the other hand, a daily close below $0.30 would probably be a null result showing possible backward movements around $0.26-$0.22.
The broader market also reflects similar behavior. As Bitcoin stabilizes, liquidity rotation into mid-cap assets like Stellar often resumes. A confirmed neckline breakout, especially with volume expansion, would likely draw more speculative capital back into XLM markets.
Market Performance and Broader Context
According to recent CoinGecko, XLM trades at $0.3298 following a fall of 5.7% over the course of 24 hours. Price movement was between $0.3258 and $0.3542 or the overall volatility of the altcoins. Although the price has reverted, the structure of the trend in the medium term would still be in place, as long as the price continues to be above the critical level of $0.30.
The market capitalization of Stellar is about $10.55 billion dollars and the fully diluted market value is about $16.49 billion. The current supply circulation of $31.99 billion out of 50 billion tokens indicates limited dilution ahead — a favorable metric for long-term holders.
Trading volume at $360 million within 24 hours shows ongoing participation, reflecting steady liquidity even during short-term corrections. The constant turnover points out the preparedness for price reactions as soon as the technical confirmation comes. In case XLM keeps solid ground over $0.30, the move back to the neckline at around $0.42 can be seen as the beginning of the overall recovery cycle.


