
- Solana is trading around a critical resistance area following a long duration of 3,700% growth, defining the following significant directional change.
- A weekly close above $230 could trigger a macro advance toward $1,300, while rejection may send SOL back toward $50.
- Short-term support near $180 remains key as the market transitions from correction to consolidation amid declining volume.
Solana’s technical setup signals a pivotal market phase following an extraordinary multi-year rally. The asset now faces critical resistance, where market momentum will determine whether it sustains its long-term uptrend or reenters a corrective phase.
Multi-Year Structure Defines Solana’s Critical Resistance
The Solana chart (SOL/USDT) every week is characterized by a decisive turnaround following a 3,700% recovery since its 2022 lows. Price action indicates that there is a strong horizontal resistance between the $220 and 230 range which serves as a significant obstacle over the recent months. The market’s response at this range will likely establish Solana’s trajectory in the coming cycle.
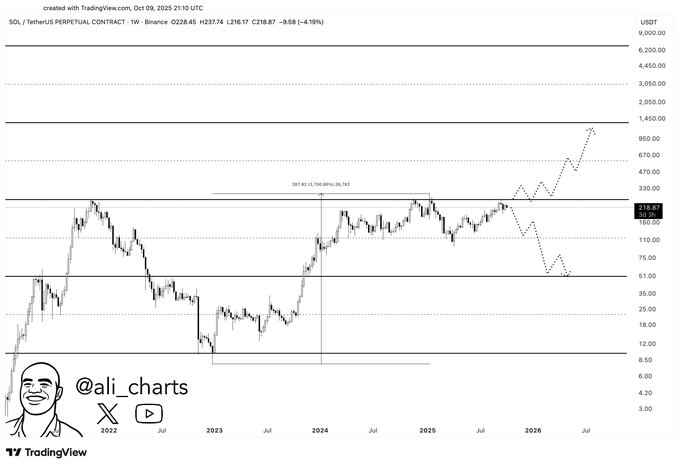
Ali, through his chart post, asked: “After a 3,700% rally, what’s more likely for Solana $SOL: a correction to $50 or a rally to $1,300?” His view frames the current consolidation as a prelude to volatility expansion. Fibonacci estimates show a sustained rise above $230 may kick off an uptrend to $470 with long-term objectives extending to $1,300 as a 1.618 Fibonacci extension of the multi-year growth.
Inability to get a breakout, on the other hand, may force Solana back to even lower structural layers. The potential downside scenario points to $115, and in extended weakness, a full retracement toward $50 remains technically possible. Both outcomes illustrate the scale of risk concentration currently forming under resistance.
Market Behavior Points to Structural Reaccumulation
From a structural standpoint, Solana’s pattern of higher highs and higher lows since 2023 indicates continued recovery momentum. Despite supply pressure near the upper resistance, the underlying trend retains bullish characteristics supported by time-based accumulation on the weekly timeframe.
The price compression near the $230 level reflects long-term holders absorbing liquidity from shorter-term traders. Historically, such consolidation phases tend to precede trend continuation, especially when volume remains steady and open interest stabilizes. This technical behavior implies that the next directional move—up or down—will likely produce a sustained multi-month trend.
The chart’s projection aligns with cyclical crypto market behavior, where extended rallies are often followed by high-volatility range breakouts. For Solana, this phase represents both opportunity and risk as speculative capital begins to rotate back toward large-cap altcoins.
Short-Term Trading Data Reflects Stabilization Efforts
Solana trades close to $181.26 in recent market data, which is a 1.27% per day decrease. It has a market capitalization of 99.07 billion with a circulating supply of 546.56 million SOL and a 24-hour volume of $9.68 billion which is strong liquidity in spite of temporary weakness.
The asset has been falling over the past few days, with a fall of $210 to $172 and a stabilization of over $180. The more compressed formations of the candles signify decreased volatility and possibly accumulation, whereas the lesser downward momentum signifies a better balance within the market. This phase reflects a typical post-correction structure where buyers begin absorbing supply near key support.
Analyst commentary states that it is necessary to remain strong above $180 in order to maintain short-term recovery. The resistance is still stacked between $186 and $192 with a decline to below $174 perhaps causing a new negative impetus to $170. A low trading volume is also an indication of a stop in the speculative activity, and so is a reduction of more than 50% of the trading volume, since consolidation characterizes trading behavior.


