
- Ethena’s resistance at $0.67 aligns with heavy on-chain cost clusters, reflecting strong sell-side pressure.
- Major support levels at $0.45 and $0.35 define the lower boundaries of current market stability.
- The volume of trading increased 235% in the liquidation-driven volatility, indicating a short-run speculative phase.
Ethena (ENA) is in a critical technical stage as the market becomes unsettled. Recent information shows tight resistance around the $0.67 mark, where the buyers are holding $0.45 and $0.35 supports. The structure suggests a market balancing between recovery and renewed correction.
Ethena Confronts Heavy Resistance Amid On-Chain Supply Clusters
Ethena (ENA) faces a crucial test as its price approaches a dense resistance level near $0.67. Analyst Ali shared a Glassnode-generated cost basis heatmap outlining areas where large volumes of ENA were historically acquired. The darker zones on the chart depict regions of concentrated holdings, serving as potential barriers or support depending on market direction.
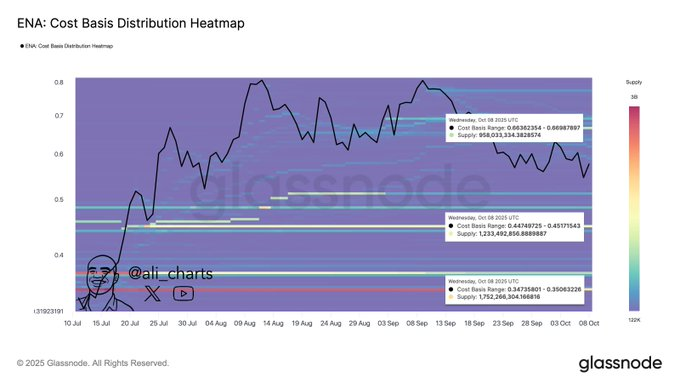
At the upper boundary, $0.67 marks the most formidable resistance. This area contains a substantial concentration of previous buyers who may seek to exit once prices revisit their cost basis. Each approach to this zone has triggered selling pressure, suggesting that breakeven exits continue to dominate sentiment. The persistent rejections from this level indicate that bulls must generate stronger demand to establish sustained movement beyond it.
The heatmap also reveals how earlier rallies attracted speculative positioning that has yet to fully unwind. As a result, this upper resistance remains dense with unrealized positions, limiting short-term upside potential. Only a decisive break above $0.67 could reset expectations and attract sidelined capital back into the market.
Key Support Zones Define Market Stability
Below the resistance area, two primary support levels frame Ethena’s current structure. The first zone sits around $0.45, where over 1.23 billion ENA have a realized cost basis. Historically, this level served as a buffer during previous corrections, giving traders confidence to re-enter or defend their positions.
The second and deeper support base lies near $0.35, underpinned by roughly 1.75 billion ENA in long-term holdings. This band represents a value region where strategic investors accumulated positions during earlier consolidations. If price action weakens further, this range could act as a final stabilization point before longer-term participants begin to rebuild exposure.
These cost clusters form the structural foundation of Ethena’s short-term landscape. As the market consolidates, defending these levels becomes critical to maintaining investor confidence. Constant trading in this corridor is an indication of a balancing point between sellers and buyers, and may be followed by a subsequent break out or breakdown.
Market Volatility and Structural Realignment
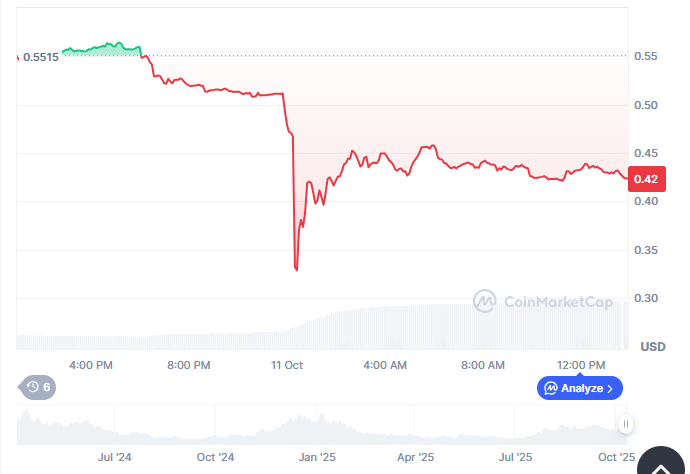
ENA has fallen by 22.93% to a low of $0.4238 over the last 24 hours, with a sharp rise in trading transactions. The 235% increase in 24-hour volume, topping at $1.05 billion, is indicative of intense speculative engagement after extensive liquidations were executed across the altcoin market. Large volume spikes frequently indicate opportune buying and panic selling as traders reprice.
According to Ethena Labs, the recent turbulence was driven by broader market liquidations that also affected their USD product. Despite the volatility, the protocol confirmed that all minting and redemption operations remained stable, helping prevent deeper structural stress.
Ethena has a market capitalization of $3.03 billion, structure wise and a supply of ENA in circulation of 7.15 billion out of 15 billion. Its fully diluted valuation (FDV) is at an estimated value of $6.35 billion whereas the total value locked (TVL) is solid at $14.29 billion meaning that it is still participating in the ecosystem, despite transient weakness.
When ENA maintains a movement over $0.45, there is a possibility that buyers will make an attempt to recover to mid-range resistance. However, failure to hold this zone may expose the asset to a deeper test near $0.35, where long-term accumulation could once again emerge.


