

- Dogecoin’s MACD crossover and trendline bounce mirror past rallies, hinting at another potential breakout toward the $0.48 region.
- Volume and RSI strength confirm a solid breakout, with price reclaiming bullish momentum above key short-term resistance levels.
- Liquidity gap between $0.270 and $0.365 may drive rapid upside if momentum holds, echoing past explosive DOGE price moves.
Dogecoin’s weekly chart signals a bullish MACD crossover, historically linked with massive upside momentum. Previous occurrences delivered substantial returns, marking the setup as a repeatable technical pattern based on trendline interaction.
Weekly Structure Respects Trendline and MACD Crossover
Dogecoin’s multi-month structure remains intact as price continues to respect an ascending dotted trendline since early 2024. Historical breakouts occurred when the price bounced off this line, forming a MACD bullish crossover. Each instance triggered notable rallies, aligning technical indicators with market reaction and volume expansion.
After reviewing the latest candle structure, technical expert Bitcoinsensus has provided additional insights on DOGE’s behavior. This analysis confirmed the presence of a bullish MACD crossover as the blue line crosses the orange signal line. Bitcoinsensus compared this to March 2024, where DOGE surged 165%, moving from below $0.09 to $0.23.
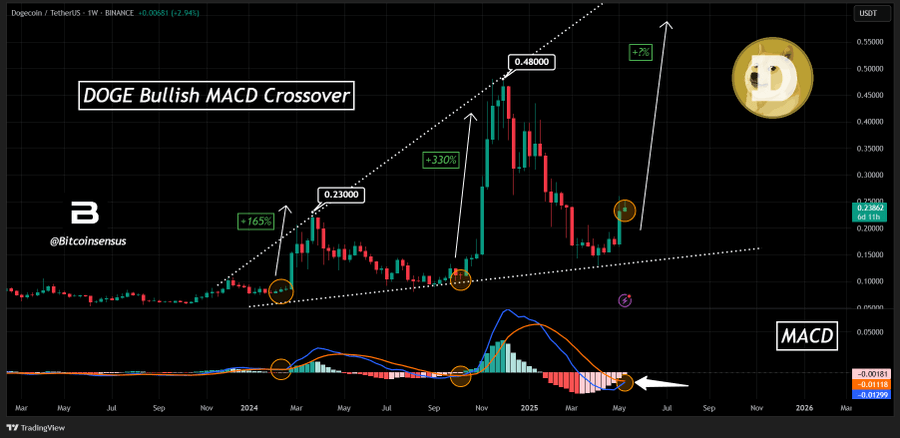
The analyst added that in October 2024, the price formed a higher low near $0.11 before rallying 330% to reach $0.48. That move followed another bullish MACD crossover with stronger histogram bars and accelerating volume. Each rally started near the same trendline support, validating its strength in the ongoing bullish structure.
DOGE recently bounced from $0.13, aligning with this pattern for the third time. The MACD histogram now turns green again, reflecting growing bullish momentum. The analyst also pointed out a resistance channel that intersects around $0.48, adding weight to that price target. He linked the pre-$0.23 and pre-$0.48 rallies to the current setup, stating the conditions remain structurally similar.
DOGE Momentum Aligns With Channel Break and Volume Shift
Jonathan Carter presents a comparative analysis focused on DOGE’s descending channel breakout on the 3-day timeframe. He observed that the pattern shares key similarities with prior continuation phases and rising RSI levels above 70.

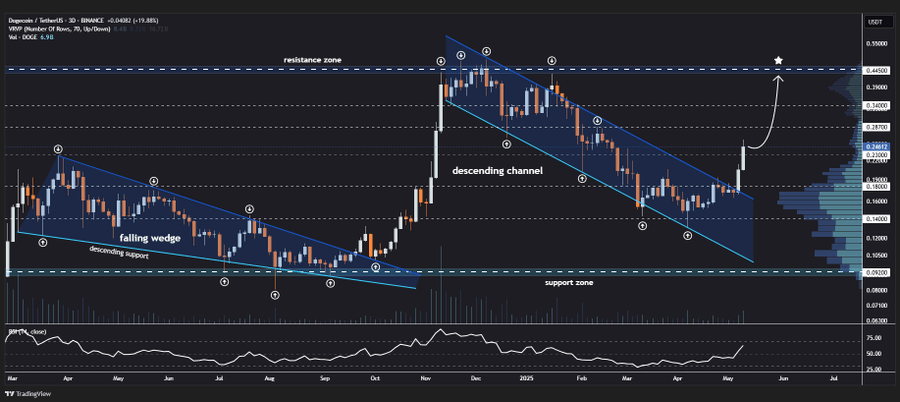
According to his latest observations, DOGE has broken above the channel’s resistance, reclaiming short-term bullish structure. Jonathan identified potential mid-term targets at $0.287, $0.340, and $0.445 based on historical reaction zones. His chart also shows RSI trending upward with increased volume, confirming bullish momentum.
Volume profile analysis reveals a liquidity gap between $0.270 and $0.365. This opens the door for fast upward movement if momentum sustains. Carter emphasized the importance of the current support structure, which has consistently held across DOGE’s long-term bullish formation. Both analysts referenced critical MACD behavior, volume trends, and support zones, reinforcing current breakout momentum across timeframes.


