- SHIB slipped after several failed attempts to hold above $0.00000470, leaving buyers under pressure during recent trading.
- The $0.00000446 support level is in focus, highlighted by hidden bullish divergence and a near 37 RSI reading.
- Reclaiming $0.00000477 could send SHIB toward $0.00000496, while a support breakdown would expose further downside.
SHIB price maintains its downtrend, and bulls are finding it difficult to hold on to the recent highs and recover key intraday resistance points.
Buyers Face a Test at $0.00000446
Whale Alert Desk recently pointed to $0.00000446 as an important support level. Its hourly chart showed SHIB declining from around $0.00000500. However, the latest candles suggested that sellers were losing some strength.
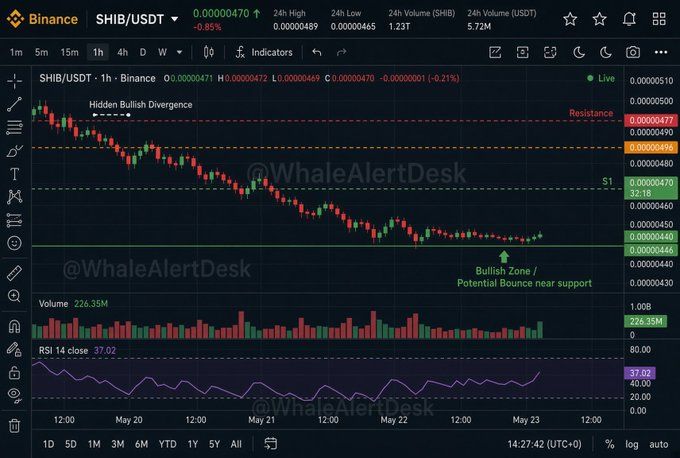
The chart also marked hidden bullish divergence near the lower trading range. This formation suggests that an existing upward movement could regain strength. Yet, buyers still need a convincing move before that possibility gains support.
SHIB must first overcome resistance at $0.00000477. A firm hourly close above this level would give buyers room. It would also place the next resistance at $0.00000496 within reach.
That upper level marks the next target in the recovery setup. Buyers would need sustained demand to carry prices that far. Failure to clear initial resistance could leave SHIB trading sideways.
Repeated Rejections Keep Sellers in Control
The subsequent market data as of writing showed SHIB trading at $0.000004635. The token had lost 0.91% over the preceding 24 hours. Its intraday movement showed sellers gaining ground after earlier buying attempts.
The previous gains pushed SHIB up to the $0.00000470 level. More progress came close to $0.000004725 but the price moved back down. Sellers then pushed the token back towards its previous trading range.
It took a turn for the worse in the morning trading session. SHIB had fallen to $0.00000465 and bounced a few times thereafter. None of those attempts generated a sustained move above the local resistance.

Recent trading has concentrated between $0.000004625 and $0.00000465. Buyers have stepped in whenever prices approached the lower boundary. However, their bids have yet to produce a convincing recovery.
RSI and Volume Offer Further Clues
The Hourly RSI was at 37.02. That’s under the lofty benchmark of 50 that’s watched closely. It captures the selling pressure which has driven the price action over the last few weeks.
However, the RSI has started turning upward from lower readings. A continued rise toward 40 would show further improvement. A move above 50 would offer stronger evidence of recovering buying strength.
Trading volume has also increased during the latest 24-hour period. CoinMarketCap’s displayed figures showed volume reaching $31.68 million. That represented a 2.61% increase while the token traded lower.
The market capitalization of SHIB was almost $2.73 billion in the snapshot. The circulating supply of its tokens was displayed at about 589.23 trillion tokens. The numbers came amid a weak market that still had some upward momentum.
The next test will come in the form of the handling of the levels close by the buyers. A defense of $0.00000446 would maintain the previous bullish configuration. A move above $0.00000477 could bring $0.00000496 into focus. If support is broken, it would have a negative impact on the divergence signal, and sellers would take over.