- Chainlink broke above a long-term falling wedge, shifting attention toward higher resistance and possible double-digit targets.
- Rising trading volume and steady intraday gains reflected improving market participation during the latest recovery session.
- Technical momentum remains constructive as LINK attempts to hold above former resistance turned potential support.
Chainlink Price attracted renewed attention after a long-term breakout aligned with stronger intraday momentum, prompting traders to monitor whether improving technical conditions can sustain the developing recovery.
Falling Wedge Breakout Changes Technical Outlook
ZAYK Charts shared a daily chart showing LINK breaking above descending wedge resistance. The post described the move as an expected bullish breakout. It also pointed toward possible double-digit territory.
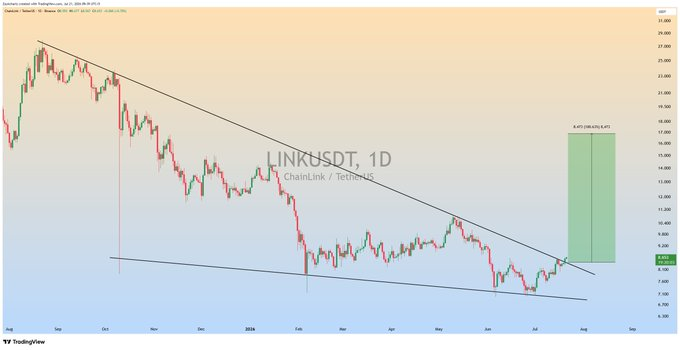
The falling wedge developed after several months of persistent selling pressure. Lower highs repeatedly formed beneath descending resistance. Meanwhile, buyers continued defending the lower trendline.
Price compression gradually reduced bearish momentum throughout the pattern. Selling pressure weakened as the wedge matured. Buyers increasingly absorbed available supply before the breakout.
The breakout above resistance changed the broader technical structure. Traders now await confirmation through sustained price strength. Maintaining higher levels remains the immediate technical objective.
Recovery Gains Support From Market Activity
Chainlink as of writing, traded at $8.71, posting a 3.92% gain over the previous twenty-four hours. The recovery unfolded through consistent higher highs and higher lows. Buyers maintained control despite temporary intraday pullbacks.
The session began near lower trading levels before demand strengthened. Early profit-taking briefly interrupted the advance. Buyers quickly regained momentum after absorbing selling pressure.

Trading volume increased by more than 52% during the recovery session. Rising participation supported the upward movement. Stronger volume often accompanies improving market confidence.
Chainlink’s market capitalization stood near $6.51 billion during the session. Circulating supply remained approximately 748.09 million LINK. The project also retained a reported profile score of 99%.
Resistance Zone Becomes the Next Focus
The breakout projection targets the mid-teen price region on the chart. That measured move reflects technical pattern analysis. Traders continue monitoring whether momentum supports further advances.
Former wedge resistance now becomes an important support area. Successful retests often strengthen bullish continuation patterns. Losing that level could trigger another consolidation phase.
The longer-term chart also interrupts the previous sequence of lower highs. Establishing higher lows would reinforce the recovery structure. Market participants continue watching for additional confirmation.
ZAYK Charts’ analysis places LINK at an important technical stage. The combination of breakout confirmation and improving momentum supports renewed market interest. Attention now shifts toward whether buyers can sustain strength above former resistance while pursuing higher technical objectives.