- SUI continues defending the $0.73 support region despite repeated rejection near short-term resistance levels.
- A long-term A-B-C-D-E structure keeps bullish continuation scenarios active toward higher Fibonacci targets.
- Trading volume surpassed $559 million as SUI maintained active participation during ongoing market consolidation.
SUI remained near critical support after recent volatility, while traders monitored a developing higher-timeframe structure projecting possible altseason continuation toward significantly higher resistance regions.
SUI Structure Maintains Long-Term Bullish Formation
Sui Insiders recently shared a chart outlining a developing A-B-C-D-E structure. The setup showed SUI respecting a broad ascending price channel. Traders closely followed the projected continuation roadmap afterward.
The chart identified a potential value zone near current support conditions. Buyers continued defending lower trend boundaries despite recent market weakness. That behavior preserved the broader macro structure for now.
Multiple reactions across channel resistance and support reinforced technical relevance. Previous rallies repeatedly stalled beneath important Fibonacci extension regions. Corrections later returned toward established support before stabilization emerged.
The projected roadmap suggested possible upside continuation toward the $8.25 resistance region. That level aligned with previous resistance and Fibonacci confluence areas. Market participants monitored whether momentum could eventually revisit that target.
Current Consolidation Keeps Traders Cautious
SUI as of the time of writing, traded at $0.7525 after recording a modest daily decline recently. The market continued fluctuating between roughly $0.73-$0.77 levels. Price action remained volatile but relatively contained throughout the session.

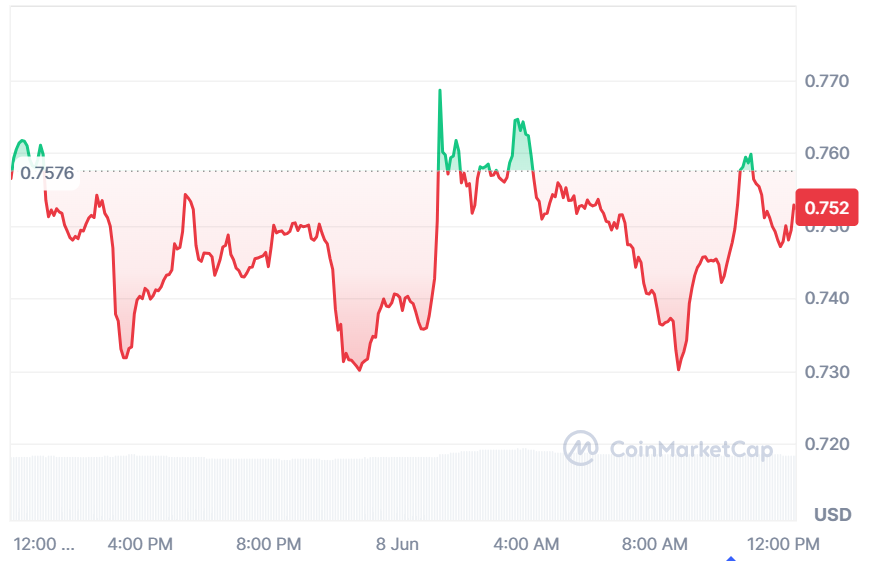
The chart showed sellers gradually pushing prices lower during early trading activity. SUI later dropped toward the $0.732 support region before recovering quickly. Buyers returned immediately once the market tested lower liquidity areas.
Several rebound attempts failed near the $0.760 and $0.765 resistance zone. Traders appeared cautious about chasing momentum beyond short-term resistance boundaries. The repeated rejection limited immediate bullish continuation prospects.
Still, bearish momentum remained relatively weak beneath the established support floor. Each decline into lower levels attracted visible buying activity afterward. That pattern suggested accumulation behavior rather than aggressive market capitulation.
Volume Activity Supports Broader Market Interest
SUI maintained elevated trading activity despite broader uncertainty across altcoin markets. Twenty-four-hour trading volume reached approximately $559.83 million during the consolidation phase. Market participation remained active across both spot and derivative activity.
The token’s market capitalization currently stands near $3.03 billion according to data shown. Fully diluted valuation remains close to the $7.52 billion level. Circulating supply reached roughly 4.02 billion SUI tokens.
Momentum indicators on the broader chart also reflected stabilizing market conditions recently. The MACD histogram showed signs of recovering from earlier bearish momentum pressure. Signal lines also began curling upward from compressed levels.
The broader structure still depends heavily on maintaining ascending channel support conditions. A confirmed breakdown would weaken the current continuation framework considerably. Until then, traders continue monitoring whether consolidation transitions into another expansion phase.