

- Stellar (XLM) replicates its 2017 Wyckoff structure, signaling potential entry into a new parabolic expansion phase.
- XLM would trade around $0.33 with an increasing liquidity and volume, and the investor confidence is back.
- The current structure shows accumulation and re-accumulation stages, suggesting institutional participation before a major breakout.
Stellar (XLM) is hinting at a comeback. Its market moves are starting to look like they did back in 2017 when it took off. With more investors getting involved, steady funds flowing in, and the price holding above $0.32, it looks ready to take the next step up.
Stellar Mirrors 2017 Market Structure
Stellar (XLM) appears to be repeating a familiar long-term pattern as its price structure closely resembles the 2017 Wyckoff cycle. The asset’s recent performance shows that market conditions are aligning once again for a potential large-scale expansion phase.
Market analyst EᴛʜᴇʀNᴀꜱʏᴏɴᴀL shared a comparative chart showing XLM’s monthly structure between 2015–2018 and 2023–2026. The chart reveals three distinct Wyckoff phases—accumulation, re-accumulation, and distribution. In the earlier cycle, Stellar spent nearly two years consolidating before a strong breakout in early 2017 that propelled prices toward $0.75. The same pattern appears to be developing again, with XLM currently navigating the re-accumulation stage.
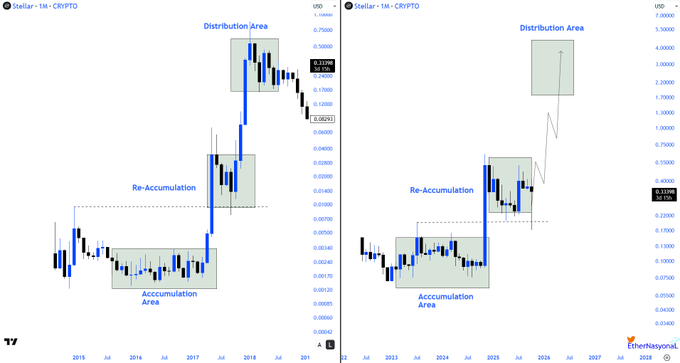
This setup shows tightening price action and consistent higher lows, which often indicate strategic accumulation by large holders. The chart projects a potential “markup phase,” the stage where demand exceeds supply and price momentum accelerates rapidly. This suggests that XLM could soon move into a parabolic trend similar to its previous historic rally.
Re-accumulation Signals Building Momentum
XLM’s ongoing consolidation presents structural symmetry to its earlier bull cycle. In both instances, the asset transitioned from deep accumulation to silent re-accumulation before a decisive upward shift. Historical data shows that when volatility narrows while volume gradually increases, it often precedes a major trend reversal.
The formation visible on current charts supports this thesis. After months of steady accumulation, Stellar’s price behavior signals reduced sell-side pressure. According to Wyckoff theory, such quiet phases precede expansion as liquidity consolidates into stronger hands. If history maintains its rhythm, the next stage could see prices accelerate toward the $2.50–$3.00 region, marking the next potential distribution zone.
Momentum indicators on higher timeframes show flattening movement, implying that downside exhaustion may be largely complete. The resemblance between the 2017 and present market conditions strengthens the argument that XLM may be approaching its next structural breakout.
Stellar Gains Renewed Strength Above Key Support
XLM is trading close to $0.3296, up 1.3% today, according to CoinGecko. It’s been moving between $0.3219 and $0.3366, showing more action lately.The trading volume jumped to $310.99 million in the last 24 hours, which means more people are getting involved and putting money in.
The current market cap is $10.55 billion, and the FDV is $16.48 billion. There are about 32.02 billion tokens in use out of a total of 50 billion, so inflation shouldn’t be too much of a worry.This supply stability provides a favorable setup for long-term accumulation.
If XLM maintains its position above the $0.325 support area, technical structure suggests that further upside movement could follow. A close above $0.335–$0.34 may open the path toward the $0.35–$0.37 resistance range. Rising volume and stable market capitalization collectively point to sustained investor confidence and a gradual strengthening of Stellar’s market base.


