Key Insights:
- Solana trades near the $76.45 consolidation floor after six consecutive weekly losses, increasing focus on a potential breakdown scenario.
- Long to short ratio at 0.89 and negative funding rates confirm rising short exposure across derivatives markets.
- A daily close below $76.45 exposes Solana to further downside toward the February 6 low near $67.50.
Solana fell nearly 6% on Monday, pushing its price close to the lower boundary of its consolidation range at $76.45. The token has already posted six straight weeks of losses since mid January. Consequently, traders now focus on whether this support can contain the ongoing slide.
Market data shows that price action has weakened through the past week. Besides, momentum indicators suggest that sellers continue to control short term direction. The market now treats the $76 zone as a decisive technical level.
Derivatives Market Signals Growing Bearish Bias
Futures positioning reflects a clear tilt toward downside expectations. Data from CoinGlass shows that Solana’s long to short ratio has dropped to 0.89, which marks one of its lowest readings in over a month. Therefore, more traders now position for additional price declines rather than a rebound.
Funding rates have also turned negative. Current funding stands at minus 0.0245 percent, close to levels seen during the early February selloff. Additionally, negative funding confirms that short sellers pay premiums to hold their positions, reinforcing the broader bearish tone across derivatives markets.
Technical Indicators Point Toward February Low
Technical charts show that Solana hovers just above the $76.45 support band. If the token closes below this level on a daily basis, analysts expect a move toward the February 6 low near $67.50. Hence, this area stands as the next visible downside target.
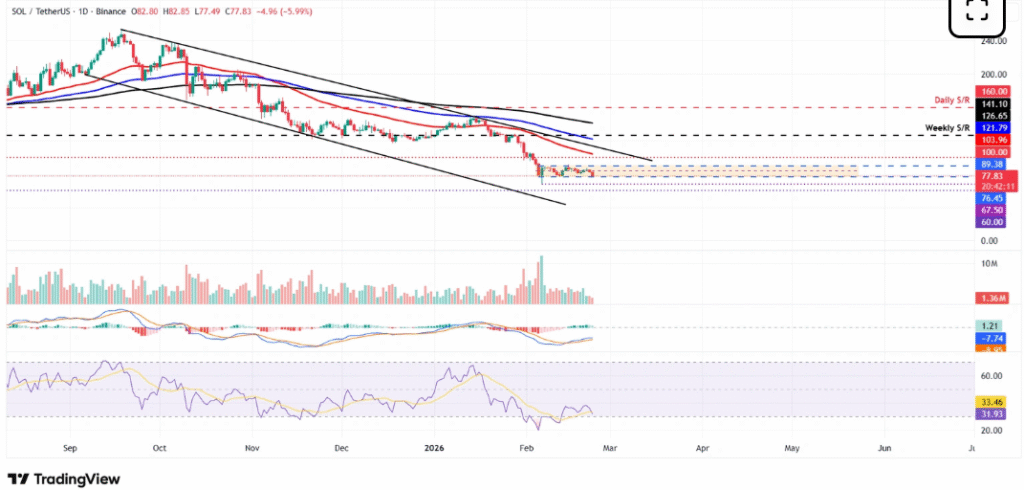
The Relative Strength Index reads 31 and trends lower, approaching oversold territory. Moreover, the Moving Average Convergence Divergence indicator shows converging lines, which signals weakening bullish attempts and rising indecision. Together, these indicators underline sustained downside pressure.
Consolidation Range Defines Immediate Path
Solana continues to trade inside a defined consolidation structure. The upper boundary of this range sits near $89.38, while the lower boundary rests at $76.45. However, repeated tests of support often increase the risk of breakdown.
If buyers defend the lower range, price could attempt a recovery toward the upper boundary. Significantly, any rebound would require stronger volume and improved derivatives sentiment to regain traction. Until then, the broader structure reflects a market under pressure.