- SOL Price remains above a major Fibonacci retracement zone tracked by long-term market participants.
- Funding rates stay near neutral despite months of decline, signaling balanced derivatives positioning.
- Short-term recovery above $66 follows strong buying interest after a sharp overnight pullback.
SOL Price remains under close market scrutiny as traders monitor a critical support region. Recent trading activity, funding data, and long-term chart structures continue attracting attention across the Solana market.
Fibonacci Zone Draws Market Attention
A social media post by analyst CryptoPatel pointed to a familiar setup for Solana. The analysis focused on the 0.5–0.618 Fibonacci retracement range. That zone previously preceded a major advance for the asset.
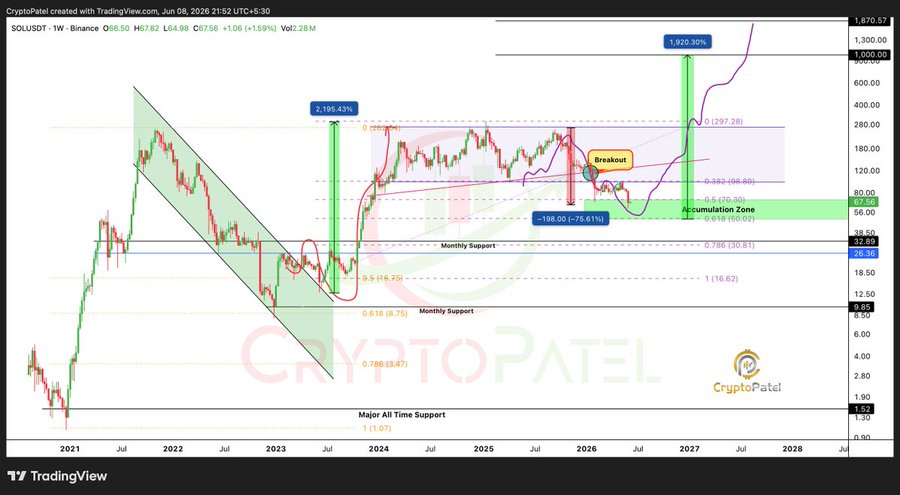
The chart presented a weekly perspective of Solana’s market structure. It showed the asset returning to a historical accumulation area. Market participants often monitor such zones during corrective phases.
According to the chart, the identified accumulation range sits between $40-$60. The highlighted area aligns with key Fibonacci support levels. Solana is currently trading near the upper section of that region.
The same chart compared the current setup with a previous cycle. During that earlier period, Solana advanced more than 2,200%. Traders are now assessing whether a similar structure can develop again.
Funding Data Reflects Cautious Positioning
Derivatives data offers another perspective on current market conditions. The OI-weighted funding rate has remained relatively stable. This trend persisted despite a prolonged decline in price.
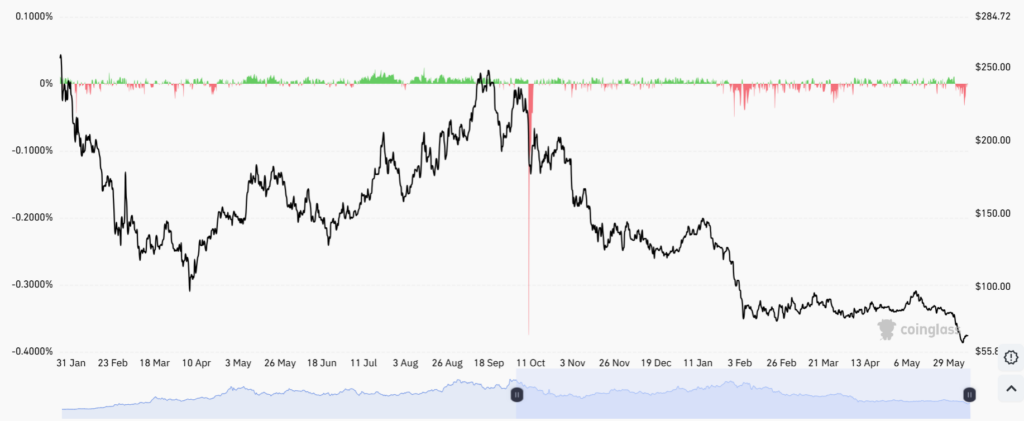
Funding briefly turned sharply negative during a major selloff period. That move coincided with a strong rejection near previous highs. Since then, readings have generally remained close to neutral.

Negative funding has appeared more frequently since February. However, those readings have not reached extreme levels. This suggests bearish positioning exists without widespread panic.
The absence of aggressive positive funding is also notable. Speculative enthusiasm remains limited across derivatives markets. As a result, leverage conditions appear considerably calmer than previous peaks.
SOL Price Stabilizes Above Near-Term Support
As of the time of writing, trading activity showed improving short-term momentum. SOLas of the time of writing, traded around $66.58 during the latest session. The asset also posted a modest daily gain.
The market briefly fell toward the $65.40 region overnight. Buyers responded quickly after the decline. Their activity helped push the asset back above $66.
Resistance remains concentrated between $67.50-$68.00. Several attempts to break that zone stalled. Even so, repeated tests indicate continued buying interest.
Volume increased by more than 10% during the recovery period. Higher participation accompanied the rebound from intraday lows. Traders now watch whether SOL Price can convert nearby resistance into support while maintaining stability above key accumulation levels.