Key Insights
- Shiba Inu rebounded nearly seven percent in two days as trading volume surged above $214 million, reflecting renewed market activity.
- Derivatives data shows the SHIB long to short ratio rising to 1.36, the highest level recorded in more than one month.
- Technical indicators including RSI recovery and MACD bullish crossover suggest momentum is shifting as price approaches the 50 day EMA resistance.
Shiba Inu traded near $0.0000056 on Wednesday after recovering almost seven percent during the past two days. The meme token stabilized following a short rebound that lifted market confidence after several sessions of weak price action. Besides the price recovery, rising trading activity across the ecosystem signaled renewed market participation.
Market data shows that traders returned to the asset as liquidity improved and short term momentum strengthened. Consequently, several technical indicators began to reflect a gradual easing of selling pressure.
Trading Volume Climbs to Monthly High
Data from the analytics platform Santiment shows that Shiba Inu’s ecosystem trading volume reached about $214 million on Wednesday. This level marked the highest activity recorded since early February and indicated growing participation across exchanges.
Higher trading volume often reflects stronger market interest because it signals deeper liquidity and broader engagement among participants. Moreover, the increase occurred during a short recovery phase, which reinforced the view that buyers returned after the recent downturn.
Derivatives Data Shows Rising Bullish Positioning
Derivatives markets also reflected growing optimism toward the token. According to data from CoinGlass the long to short ratio for Shiba Inu climbed to 1.36 on Wednesday.
This level represents the highest reading in more than a month and shows that traders increasingly opened long positions compared with short bets. Additionally, the ratio above one indicates that bullish traders currently dominate derivatives positioning.
Stronger long positioning usually signals expectations for further price recovery as traders anticipate upward momentum in the near term.
On Chain Metrics Reflect Mixed Market Signals
Despite the increase in bullish positioning, broader blockchain data presents a more balanced picture. Data compiled by CryptoQuant shows active trading across both spot and futures markets.
Large whale orders appeared on spot exchanges while buy side activity remained dominant in that segment. However, futures markets still showed signs of selling pressure, which indicated that some traders continued to hedge against potential downside.
Technical Indicators Point Toward Recovery
From a technical perspective, Shiba Inu managed to close above the daily resistance level near $0.0000054 earlier this week. The token extended the move by roughly four percent the following day and continued to trade slightly higher on Wednesday.
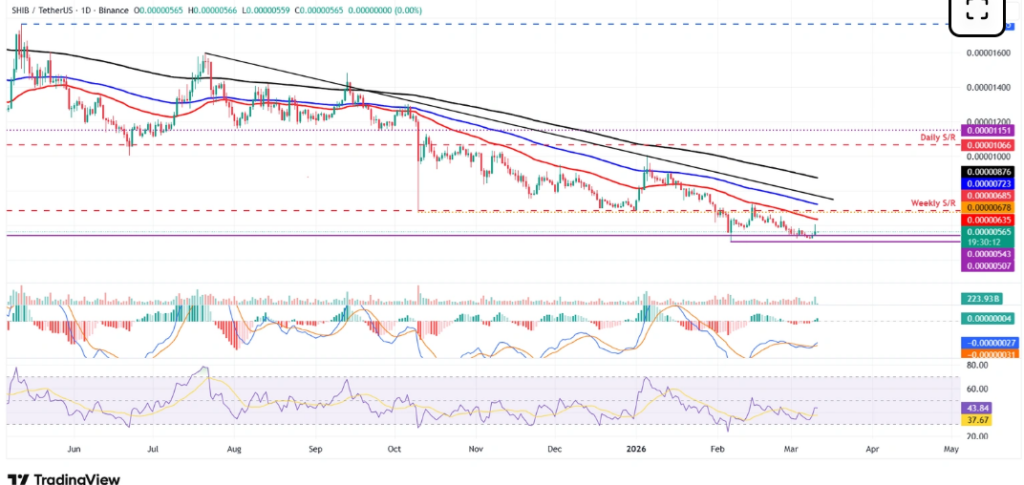
Momentum indicators began to reflect this shift. The Relative Strength Index climbed toward the neutral level, signaling fading bearish pressure. Moreover, the Moving Average Convergence Divergence indicator produced a bullish crossover during Tuesday trading.
Key Resistance Levels Come Into Focus
If the recovery continues, the next major technical barrier sits near the 50 day exponential moving average around $0.0000063. Additionally, a sustained move above that level could open the path toward the weekly resistance near $0.0000067.
However, the recent rebound still sits within a broader consolidation range. Consequently, any renewed selling pressure could pull the price back toward the February low near $0.0000050.