
Key Insights:
- Polkadot breaks above $1.40 range and reclaims 200 EMA, shifting short term structure toward bullish continuation momentum.
- Open interest collapses from $650M to $253M, reducing leverage and creating room for cleaner directional price expansion ahead.
- Spot outflows persist since May, yet recent months show slower distribution as DOT consolidates above key Fibonacci support levels.
Polkadot moved into expansion mode after buyers forced a breakout on the one hour chart. DOT climbed from the $1.27 to $1.30 base and built steady upside pressure. Consequently, price cleared the $1.35 to $1.40 consolidation band and shifted short term control to bulls.
Traders responded quickly as momentum accelerated beyond the 200 EMA. Moreover, the structure changed from sideways compression to directional movement within hours. Price advanced toward the $1.75 swing high, reflecting firm demand across lower time frames.
Key Resistance Levels Come Into Focus
DOT now trades near $1.67 as the $1.63 to $1.65 area acts as immediate supply. Besides, this zone marks the first barrier before a retest of $1.75. Buyers continue to defend higher lows, which keeps near term continuation in play.
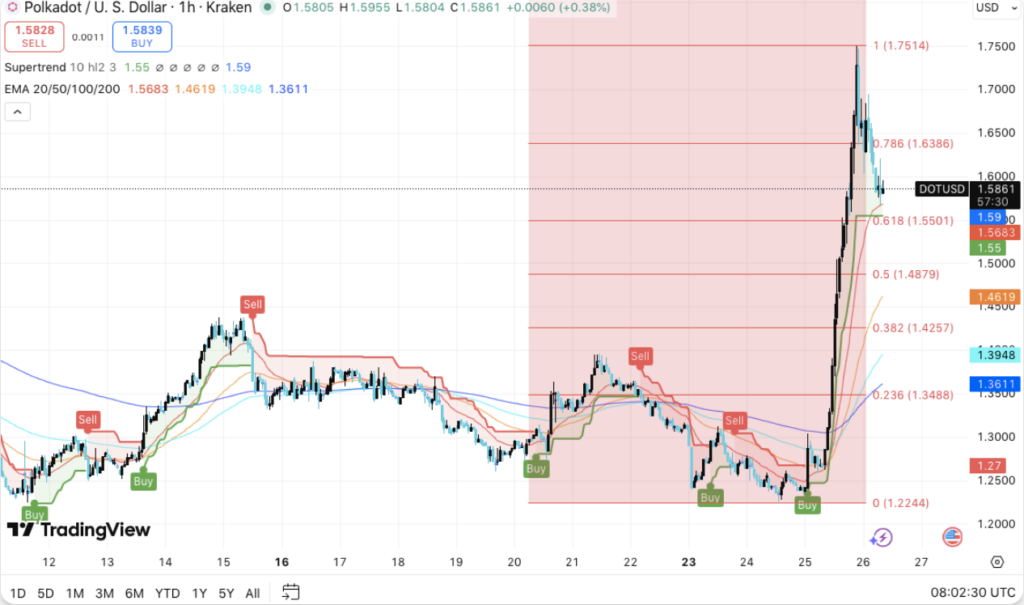
However, price remains sensitive around $1.55, which aligns with the 0.618 Fibonacci retracement. Hence, holding this level supports the current bullish structure. A decisive push above $1.75 could open the path toward $1.80 and $1.90.
Open Interest Drops After Volatility Spike
Derivatives data from CoinGlass shows a sharp reset in positioning. Earlier rallies lifted open interest beyond $600 million as leveraged traders increased exposure. Subsequently, liquidations removed a large share of those positions during sharp price swings.
Another build up pushed open interest near $650 million while price drifted lower. Significantly, that divergence suggested rising short exposure into weakness. Now, open interest has compressed near $253 million, reducing leverage across the market.
Spot Flows Reflect Slower Distribution
Spot flow data presents a cautious backdrop as net outflows have dominated since May. Additionally, September and October recorded heavy distribution that matched steep price declines. Sellers reduced intensity in recent months, although negative flows still persist.
January and February show milder outflows compared to earlier periods. Consequently, the slower pace suggests supply pressure has eased but not disappeared. DOT consolidates above support while market participants assess the next directional move.