
- PENGU tests a crucial support level near $0.012 as traders monitor early stabilization signals.
- Market structure shows controlled downside action with liquidity focusing around the support zone.
- A recovery toward $0.023 remains possible if demand absorbs pressure near the current floor.
PENGU is approaching a decisive technical zone after an extended pullback, with market participants monitoring reactions at a key support level that has shaped prior trend shifts and guided earlier phases of directional movement.
Support Zone Establishes Market Focus
PENGU remains centered around the $0.012 support zone, which traders consider a structural boundary for the current cycle. The market has returned to this price region after consistent downside movement over recent weeks. The reaction near this level is now shaping expectations for the next directional phase.
A recent update shared by analyst Ali notes that “$0.012 is the line to defend for $PENGU,” pointing to the same area as the level where buyers previously stepped in. The market has also revisited the region several times during earlier trend rotations, making it a price zone that carries weight for both short-term and mid-term positioning. The structural role of this support continues to guide sentiment among active participants.
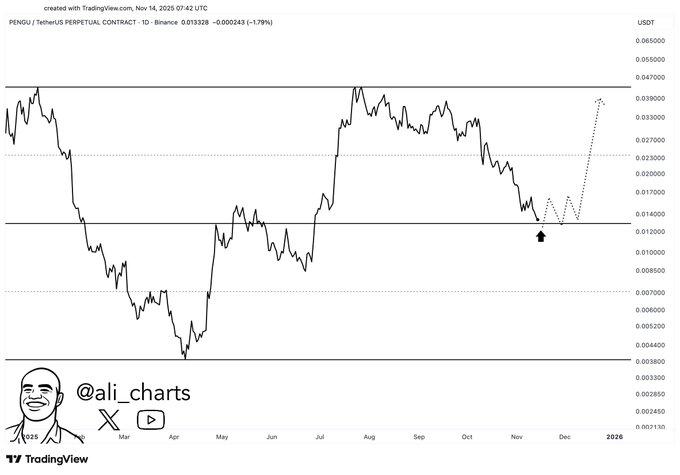
Market data as of writing shows PENGU trading near $0.01327 after a modest daily increase. Even with variability across the session, the asset’s structure still reflects controlled trading behavior. The ability to remain close to the support zone suggests that buyers are monitoring conditions closely rather than stepping aside during the correction.
Market Structure Signals a Potential Stabilization
The broader structure shows a pattern of lower highs and lower lows, which developed after the earlier rally. This movement forms a measured corrective phase rather than an abrupt trend collapse. As the pullback approaches the major horizontal zone, traders consider whether the market is shifting from distribution to accumulation.
The chart referenced in Ali’s post shows the anticipated reaction point where bulls may defend the range bottom. The arrow placed on the illustration marks the same zone where liquidity previously concentrated. Such repeated interactions with a known support band often frame the next steps for price movement. The present setup encourages close observation from market participants.
Circulating supply data adds context to the current phase. With 62.86B PENGU in circulation out of 88.88B total supply, most tokens are already active in the market. This environment reduces the risk of sudden supply shocks. The market’s response at support will determine whether the corrective cycle shifts into a stabilization phase.
Rebound Target Forms if Support Holds
The projected path discussed in the chart proposes a stabilization period above $0.012 before any extended movement occurs. This type of sideways activity often emerges near major levels as selling pressure fades and new bids form. The market has a record of responding strongly after testing major zones, which keeps participants attentive.
If PENGU secures the $0.012 area, the next target aligns with $0.023. This zone represents the next area of historical activity where sellers previously regained control. A move in that direction would signal that buyers have regained momentum and re-established short-term structure. The recovery would also validate the idea that the support has held firm.The recent milestone mentioned by the Pudgy Penguins team, noting PENGU’s visibility at the New York Stock Exchange, continues to influence broader sentiment. This event has created a narrative bridge between Web3 culture and traditional markets. While not a price driver on its own, it adds context to market engagement as traders watch for shifts in behavior around the support band.


