

- $NOT is near to a long-term down-sloping trendline, and the lower lows are increasing and buyers are regaining momentum around critical resistance.
- Bullish crossover indicates that the MACD indicator shows that the volume is increasing implying that the momentum is shifting towards the buyers and not the sellers in the daily chart.
- Any break over resistance would be the confirmed break over resistance and would likely start a fresh 100% plus rally that agrees with the anticipated target area of $0.0033 to $0.0035.
$NOT looks ready to pop as bulls begin to reclaim control after months of persistent downward pressure. The recent technical setup suggests that the token could be approaching a potential breakout point, one that may trigger a 100%+ upside move if confirmed.
Bulls Build Momentum Beneath Key Resistance
After an extended decline stretching from late 2024, $NOT/USDT has started to show early signs of strength. Price action on the daily chart indicates a clear shift in sentiment as higher lows form just below a dominant descending trendline. This structure often precedes a breakout, especially when paired with rising trading volume.
As reported by ZAYK Charts, the bulls are finally exhibiting strength in the wake of a protracted downtrend. If a confirmed breakout occurs, we could see an upside target in the $0.0033 to $0.0035 range, which translates to a potential 100%+ move from the present levels. This area is historically a past supply zone, which could easily grab renewed market interest.
The 20-day exponential moving average (EMA), that has been providing and continuing to provide resistance, is under test. An EMA brought above the daily close may be the first significant indication of a bullish reversal, and it will prove that the buyers are buying back control of the market in the short-term.
Technical Indicators Support a Reversal Setup
Momentum indicators also support the developing bullish setup. The MACD line has started to curve upward, nearing a crossover above the signal line—a move often interpreted as a transition from bearish to bullish momentum. The histogram’s shift from red to green further reinforces that selling pressure is fading.
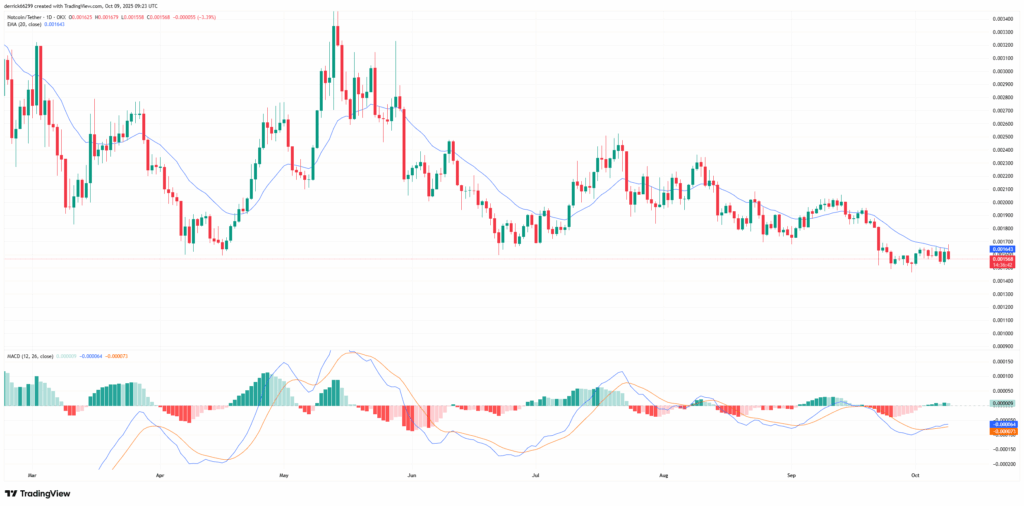
At the same time, the declining EMA is an indication that downside momentum is wearing out its welcome. These signals, together with rising volume, suggest that the accumulation can be taking place under the resistance zone. The emergence of bullish candles with high strengths illustrates the reinstatement of confidence back in the marketplace with potential breakout just around the corner.
When the price continues to operate above the 20-day EMA, and the MACD crossover confirms the market participants may take it as the beginning of the new short term upward trend.
Breakout Confirmation Could Spark a 100%+ Move
The structure of the current price action suggests that the market is coiling beneath a major resistance point. A confirmed daily breakout above the descending trendline could unleash considerable upside momentum, potentially drawing in breakout traders and sidelined investors.
ZAYK Charts’ analysis indicates that once the breakout is validated, the next logical price magnet lies between $0.0033 and $0.0035. This range represents prior supply levels that could serve as new short-term targets for bullish participants.
In general, $NOT has the potential to move significantly in case confirmation is obtained. As volume increases, momentum will pick up, and buyers look to be reasserting themselves; the technical picture places the token in the position to possibly experience the first serious bullish shakeout in months.


