
- LTC trades near a fragile support zone as the market tracks Bitcoin’s weekend direction closely.
- Falling volume and repeated support retests show caution while traders wait for a stronger setup.
- Intraday movement signals pressure as LTC lags Bitcoin with sharper swings across recent sessions.
LTC continues to face steady pressure as the market reflects a cautious tone across major assets. The chart shows the coin trading near an important support zone while recent moves remain closely aligned with Bitcoin’s weekend pattern.
Daily Structure and Market Pressure
LTC remains in a bearish daily structure after closing lower in the recent session. The coin stays within a broad multi-month range, but the current position sits near the lower half of that formation. Price trades close to the low-$80 area, which has served as an important support zone across past cycles.
Repeated tests of this region show a softer reaction with each visit, and that pattern raises concern for short-term momentum. Buyers have not shown firm interest at this level, allowing sellers to keep control of the trend. Market participants continue to monitor this zone for signs of a reversal, but no firm shift has appeared.
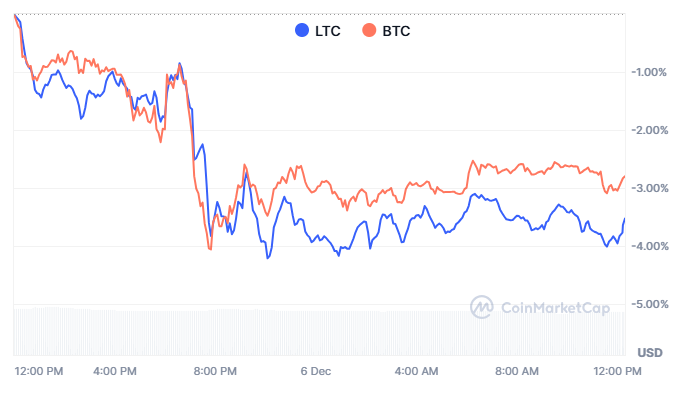
The move matches the tone of the latest post from CRYPTOWZRD, who noted that LTC is mirroring Bitcoin’s broader sentiment. The message added that intraday volatility from Bitcoin may continue to guide LTC direction through the weekend.
Intraday Action and Correlation With Bitcoin
The comparative chart shows LTC and Bitcoin moving in near-lockstep over the past day. Both assets dropped sharply during the midpoint of the session. LTC printed a deeper move during that slide, which reflects its tendency to react more sharply in quieter periods.
LTC trades around $80.32 with a 24-hour decline above 3%. The retreat fits with the broader pause across the crypto market as traders seek clearer direction. The data shows a market cap near $6.15B and a volume-to-market-cap ratio of 7%. This ratio signals lighter activity and lower participation relative to stronger trading phases.
The softer volume, marked at $430M in 24-hour activity, confirms that many traders remain cautious. This setup leaves LTC sensitive to intraday swings, especially when Bitcoin shifts quickly. The pattern has persisted across recent sessions and continues to shape market behavior.
Range Boundaries and Near-Term Outlook
LTC’s range remains well defined with resistance near the $100–$102 area. This zone has capped every recovery effort since the early-November high. The chart arrow in the earlier technical view points toward this region as the next test if buyers step in at support.
Broader resistance sits in the $130–$140 band, while deeper support rests in the mid-$70 area. LTC as of writing, trades between these levels with a weaker bias as buyers wait for stronger confirmation. The structure shows sellers steady while the market seeks a new catalyst.
Traders continue to watch the $78–$82 pocket as the next key zone. A firm defense of this area may open a path toward $90. A move above that level would break the minor lower-high sequence. Until then, LTC remains in a cautious stance with pressure shaped by Bitcoin’s fast intraday moves.