
- Litecoin maintains a bearish tone as price tracks Bitcoin’s broader trend and traders await clearer direction.
- Funding data shows shifting sentiment, with open interest easing as the recent downtrend develops.
- Short-term rebounds show cautious buying, yet broader structure remains weighed by macro pressure.
Litecoin moves through a cautious phase as it trades near multi-week support while reacting to Bitcoin’s broader trend. Market structure shows controlled pressure as traders wait for a clear directional cue on higher timeframes.
Market Structure Tracks Bitcoin’s Sentiment
Litecoin continues to follow Bitcoin’s broader mood after the daily candle closed bearish. This was noted by CRYPTOWZRD, who stated that LTC needs clearer direction from Bitcoin for a defined trade setup. As of writing movement shows the asset pressing into a familiar support region as sellers test liquidity.
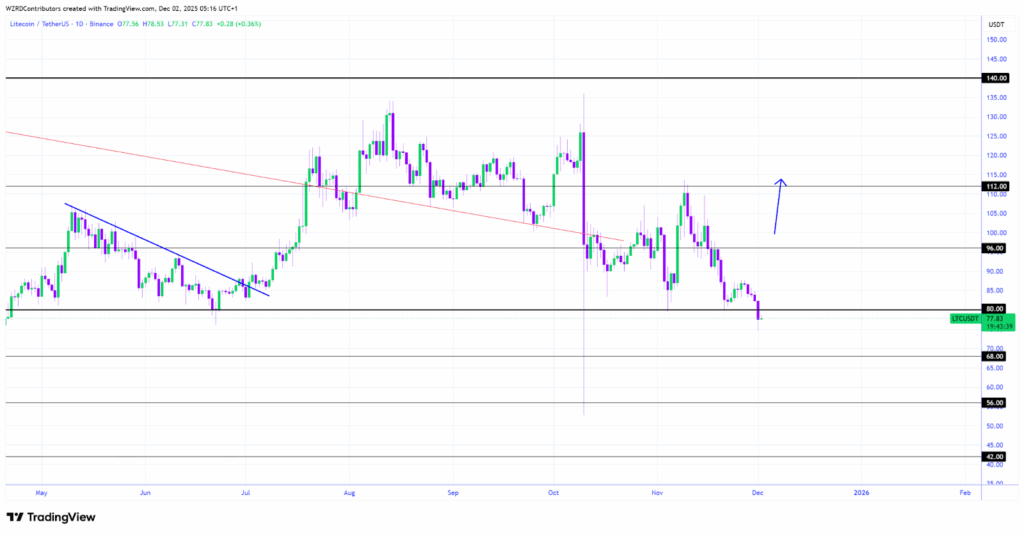
The chart structure shows a series of lower highs and lower lows forming since late October. This controlled descent reflects steady selling pressure as each rebound meets resistance around mid-range levels. Litecoin now sits near the mid-70s zone, a region that has acted as historical demand during past retracements.
The previous attempt toward the 110–115 band failed to keep momentum, causing a rotation lower. This decline mirrors Bitcoin’s weaker posture, keeping Litecoin reactive rather than leading. A shift from this posture depends on renewed stability from Bitcoin before any substantial realignment occurs.
Short-Term Movement Shows Cautious Rebound
Litecoin, at the time of the writing, is still recovering after intraday lows as it progresses between $75.16 and $78.52. The asset finished towards the end of approximately $78.62, with a 1.4% increase in the 24 hours period. This short-term reaction signals buyers responding near a familiar liquidity zone.
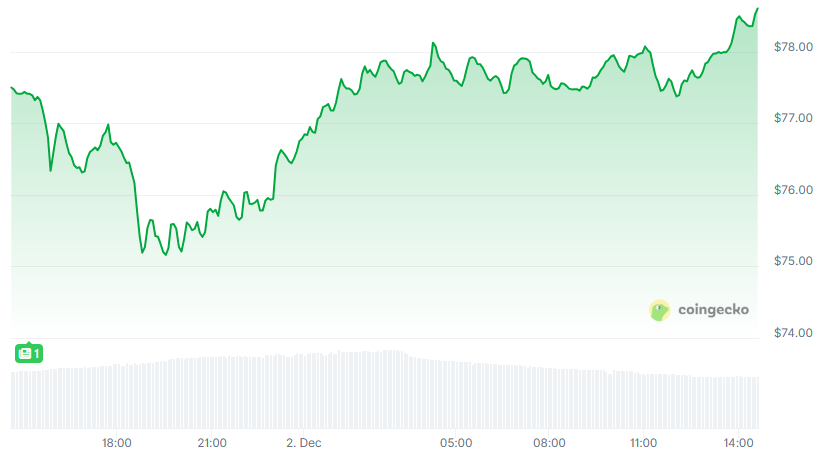
A clean V-shaped rebound appears on the chart as price lifts from mid-$75 levels. This area continues to attract short-term traders who step in when price compresses toward local support. Movement from $76 to $78 shows controlled buying without aggressive expansion.
Volume remains steady with more than $582 million traded in 24 hours. This sustained activity shows continued participation even as the broader market experiences fluctuating sentiment. The consistent flow supports the view that the short-term rebound reflects actual positioning rather than thin-market swings.
Funding Data Shows Shifting Sentiment
The multi-month chart displays funding rates hovering around neutral through much of the period. Early September saw more positive readings as the price traded above $100, showing stronger long positioning. Later readings show mixed sentiment as red segments increase across October and November.
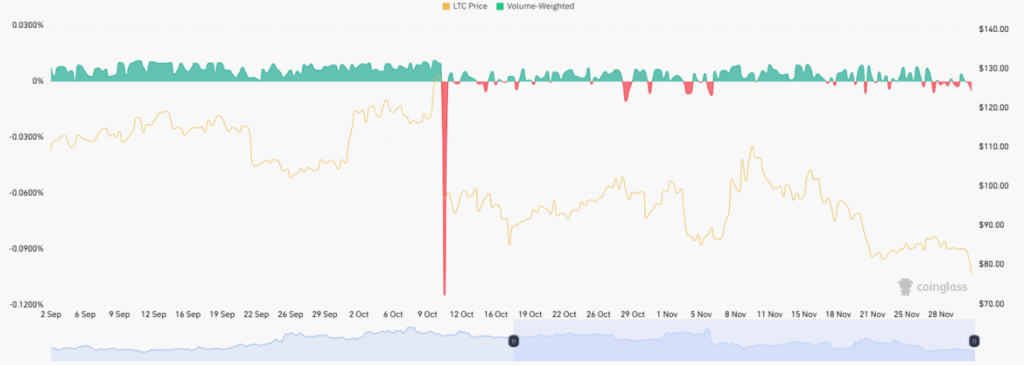
A sharp event occurred around October 11–12, when funding plunged into an extreme negative print. This move signals aggressive short pressure or rapid liquidations during a sudden price drop. Funding returned to neutral shortly after, indicating fast clearing of leveraged positions.
Price then transitioned from September strength to late-November weakness. Open interest eased as the downtrend progressed, showing traders reducing exposure. By the end of November, price approached the $80 zone as sentiment rotated toward caution.