
- Chainlink jumped ahead of Ethereum in GitHub activity, driven by surging demand for real-time data and cross-chain interaction.
- Ethereum has strong developer support, which shows steady growth in underlying infrastructure like Layer-2 and staking improvements.
- Technical graphs indicate LINK and ETH creating bullish trends, showing signs of increased investor optimism and possible breakout areas.
Chainlink (LINK) and Ethereum (ETH) are breaking out ahead of the broader crypto market, gaining 7.7% and 6.3% respectively. This performance comes amid surging GitHub development activity, positioning both assets as clear leaders in blockchain innovation and long-term ecosystem strength.
Sustained GitHub Growth Signals Developer Commitment
According to a post by Santiment, Ethereum and Chainlink have remained top contributors on GitHub over the past 30 days. Ethereum ranked 8th in overall activity, showing consistent code pushes despite recent market volatility. Its development history, mapped since 2018, shows a steady increase that intensified from 2020 to 2022, anchored by milestones like Ethereum 2.0 and Layer-2 rollouts.
Chainlink, meanwhile, ranked 2nd in GitHub activity and has demonstrated explosive growth since mid-2023. The chart shows LINK surpassing Ethereum at various intervals, with its highest GitHub peak marking the most intense development period in the dataset. These surges correlate with Chainlink’s focus on smart contract infrastructure and cross-chain interoperability, key to its institutional roadmap.
Visa Confirms Chainlink’s Institutional Readiness
Momentum around Chainlink has intensified following a high-profile showcase by Visa. According to a report by Link Collector, Visa highlighted how Chainlink addresses three institutional barriers: real-time data, cross-chain settlement, and regulatory compliance. This aligns with the broader sentiment that LINK isn’t speculative anymore—it’s foundational.
Ethereum, on the other hand, continues to serve as a stable base-layer protocol. Its steadiness on GitHub reflects long-term infrastructure refinement rather than short-term hype. Both platforms are becoming essential to global blockchain architecture, and institutional confidence appears to be catching up to developer efforts.
Fibonacci Structures Reinforce Technical Bullishness
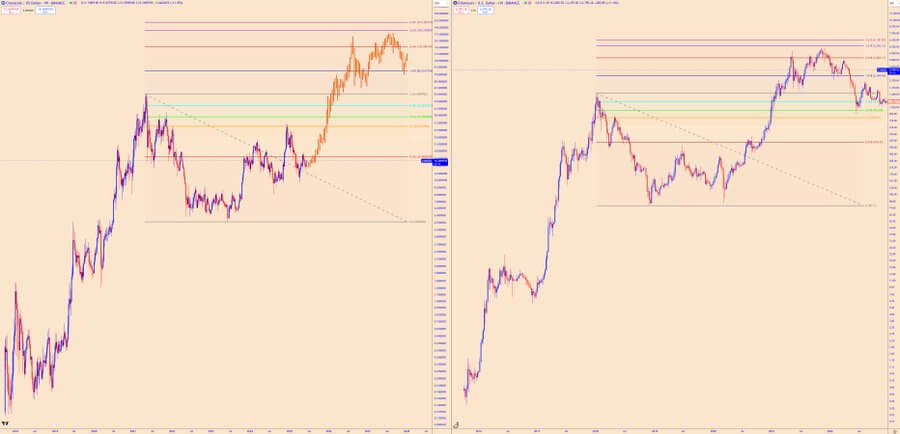
Technically, LINK surged from $4.70 to $22.80 before consolidating near $14.20, respecting key Fibonacci levels at $16.20 and $13.70. Ethereum mirrored this move, rallying from $1,530 to $4,090, and now fluctuating around $3,120. Resistance sits near $3,450 with key support at $2,800.
Traders are watching for breakout confirmation, especially in the $16–$18 zone for LINK and the $3,450 level for ETH. Both charts suggest bullish continuation patterns, with higher highs and higher lows dominating the current structure.
Momentum Shifts Back to the Bulls
Ethereum recently broke out of a symmetrical triangle, reaching $2,813.17 and possibly targeting $3,000–$3,200. Chainlink’s hourly chart shows aggressive buying with little resistance. With GitHub trends, institutional integration, and price momentum all aligned, both LINK and ETH are showing renewed strength that could lead the next crypto rally.