
Key Insights
- HYPE rose 4.75% to $30.30 after breaking out of a descending triangle, while trading volume increased 14.5% to $207.95 million.
- Arthur Hayes projected a $150 HYPE target by July 2026, driving widespread discussion and renewed investor focus across X.
- Leveraged long positions reached $14.49 million versus $4.70 million in shorts, as DeFi activity and revenue posted strong gains.
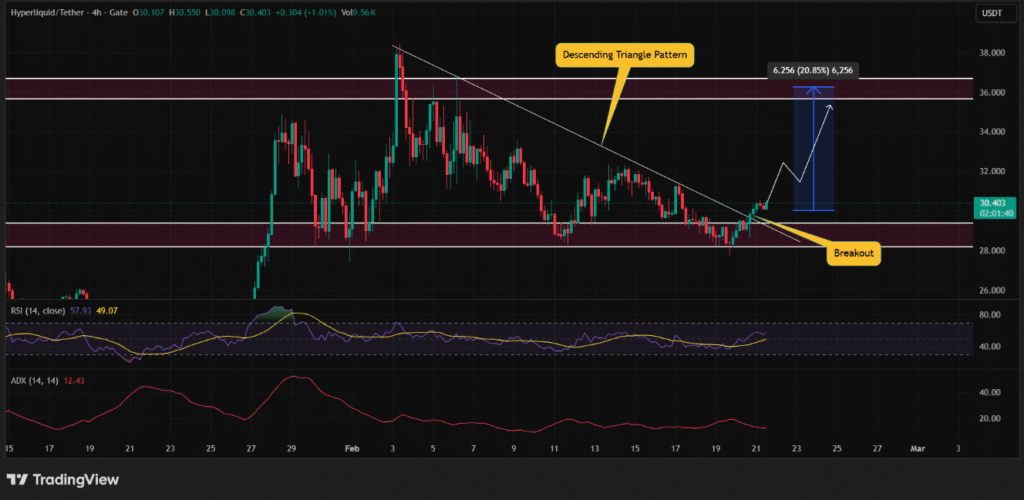
Hyperliquid HYPE extended its recovery as buyers pushed the token 4.75% higher over the past 24 hours, lifting the price to $30.30. The advance followed a clear breakout from a descending triangle on the four hour chart, shifting short term structure in favor of bulls. Moreover, trading volume climbed 14.5% to $207.95 million, signaling stronger market engagement.
Market interest intensified after Arthur Hayes, co founder of BitMEX, shared plans to accumulate more HYPE and projected a $150 price by July 2026. The statement circulated widely across X and drove fresh debate among traders. Consequently, HYPE gained additional visibility as participants weighed long term upside against near term technical signals.
Technical Structure Favors Buyers
Price action now centers on the $29 support zone, which traders view as critical for sustaining the breakout. If HYPE holds above this level, charts indicate potential room toward $36, representing roughly 20% upside from current levels. However, a decisive four hour close below $28 would weaken the bullish setup and could trigger renewed selling pressure.
Momentum indicators reflect moderate but improving conditions. The Relative Strength Index stands at 57.97, placing the asset below overbought territory and leaving space for further gains. Additionally, the Average Directional Index reads 12.26, which signals that trend strength remains limited despite the recent upward move.
Leverage Data Highlights Bullish Bias
Derivatives positioning underscores growing confidence among short term traders. According to CoinGlass data, leveraged longs cluster around $28.32, while short exposure concentrates near $30.92. Traders have built approximately $14.49 million in long positions compared with $4.70 million in shorts, reinforcing the current upward bias.
Beyond price charts, protocol activity has expanded sharply in recent days. Data from DeFiLlama shows revenue rising from $941.78K on February 14 to $1.73 million, while decentralized exchange volume increased from $57.59 million to $95.31 million. Significantly, this surge in on chain engagement aligns with the recent price breakout and reflects stronger network participation.
Traders now monitor whether sustained volume and derivatives support can maintain the breakout structure. Consequently, the $29 and $28 zones remain pivotal as participants assess continuation potential.