- HBAR trades at $0.188 after a 2.4% daily rise, signaling active accumulation amid narrowing volatility.
- Technical set-up indicates the potential technical breakout of a symmetrical triangle formation in the 3-day chart.
- Continued trades over $0.20 might get the momentum to the $0.25 zone in case of increased buying pressure.
HBAR is trading within a tightening range as price compression signals a decisive move ahead. Market participants are closely tracking the symmetrical triangle formation that may precede a major trend expansion in the coming sessions.
Symmetrical Triangle Points to Tightening Market Conditions
The recent chart shared by Clifton Fx (@clifton_ideas) highlights a symmetrical triangle pattern forming on the 3-day timeframe for HBAR/USDT. This structure represents a consolidation stage, where both buyers and sellers appear evenly matched before a breakout. The pattern has gradually narrowed over several months, signaling that volatility is contracting.
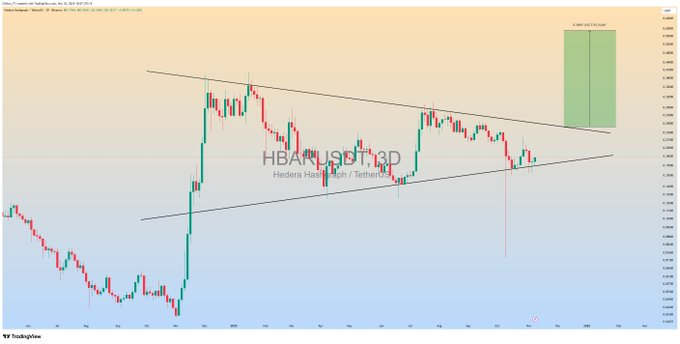
HBAR’s price has continued to form higher lows and lower highs, compressing between an ascending support and a descending resistance line. Under this technical formation, the upper resistance point is within the region of $0.095-$0.10, and the important support is within the area of $0.055. Traders consider this tight-knit range as an indication of a sharp direction change when confirmation sets in.
Clifton Fx suggested that a successful breakout above resistance could trigger a 100–200% rally, aligning with measured-move projections derived from the triangle’s height. A sustained close beyond resistance, coupled with rising volume, would strengthen the bullish case and potentially push the price toward $0.18–$0.25 in subsequent sessions.
Market Structure Reflects Steady Accumulation and Volume Growth
According to data as of writing HBAR is trading at $0.188, which is an increase of 2.4% over a 24-hour period. The trading rate of the token is noted to be between $0.1836 and $0.1976, which shows that the trading day was of moderate bullish occurrence with the trading volume maintained. It has been dipped in the short term, but the price remains above the mark of $0.185, which can indicate the continued interest of buyers.
It is listed on the market with a market capitalization of approximately $7.98 billion and a fully diluted valuation of $9.40 billion. The inflationary pressure is low as the supply of billions of the $42.47 of a possible supply of 50 billion tokens in circulation is at a low level. This stable token structure helps maintain liquidity while reducing the risk of rapid dilution, a factor often crucial during accumulation phases.
HBAR’s 24-hour trading volume of $497 million shows that participation remains strong. This consistent liquidity supports technical setups such as the triangle, as sustained activity is often a prerequisite for meaningful breakouts. Traders are now focusing on whether this consolidation will lead to renewed upward expansion or an extended holding pattern.
Critical Levels Define Upcoming Price Action
From a structural view, HBAR’s symmetrical triangle is approaching its convergence point, where direction typically becomes clear. To sustain the bullish structure, it would be necessary to maintain the support above the ascending trendline. Breakout of above $0.20 would affirm the momentum of change in the trend, which would justify the situation presented by Clifton Fx.
However, any down-slip of below 0.182 may trigger short-term lows of 0.175, and postpone the break-out prospective. Historical records indicate that HBAR is likely to have a steep rise after years of compression, which is usually after liquidity injected by market sentiment.
The current technical posture suggests that HBAR remains in its accumulation zone. Volume confirmation and candle closes above resistance will be crucial in establishing a sustainable move. Traders remain alert for volatility expansion as the pattern nears completion, potentially marking a new stage in HBAR’s mid-term trend development.


