
- ETH/BTC structure shows early momentum shifts as RSI and MACD strengthen near a long-term channel boundary.
- Ethereum’s 2025 performance trails Bitcoin, yet deep relative weakness often forms rotation foundations.
- Market sentiment remains quiet as analysts track repeated structural patterns from the 2025 summer advance.
ETH/BTC is showing early technical progress as traders monitor a familiar structure forming near the upper boundary of a long-term descending channel. Market participants now watch for any shift in momentum after a year of uneven relative performance.
Repeated Structural Patterns Support Rotation Narrative
Ethereum’s position within a long descending channel has drawn attention as the pair nears the same structural point that preceded the Summer Rally 2025. A chart review shows how the prior breakout followed a long consolidation and then accelerated rapidly. The current pattern mirrors those conditions as price again tests the channel’s upper line.
A post from 𝕄𝕠𝕦𝕤𝕥𝕒𝕔ⓗ𝕖 (@el_crypto_prof) frames this comparison, noting the technical alignment between the earlier rally and the present setup. The comment describes how ETH/BTC displayed a similar compression before its advance. Traders now track whether this symmetry develops into a breakout that could support a Winter Rally 2025/2026.
Momentum Indicators Strengthen as Sentiment Remains Quiet
RSI has moved toward a downward trendline that guided prior weakness. The indicator also shows bullish divergence, which preceded the summer rotation phase. This creates interest among market observers who recognize how momentum shifted before price broke structure earlier in the cycle. That behavior often suggests quiet accumulation.
MACD reflects a similar early movement. The indicator is curling upward and pushing toward a bullish cross while the histogram approaches positive territory. These conditions previously marked the transition into the 2025 summer advance. The analyst notes that Crypto Twitter appears unusually quiet, which often occurs before a broad rotation phase.
ETH’s Year Exhibits Deep Lows, Mid-Year Rally, and New Compression
A comparative ETH-BTC performance chart from 2025 shows how Ethereum underperformed Bitcoin through early spring. ETH fell sharply between January and May while BTC stayed closer to neutral. That trend reversed mid-year as ETH recovered strongly between late June and September, nearly matching Bitcoin’s position before declining again.
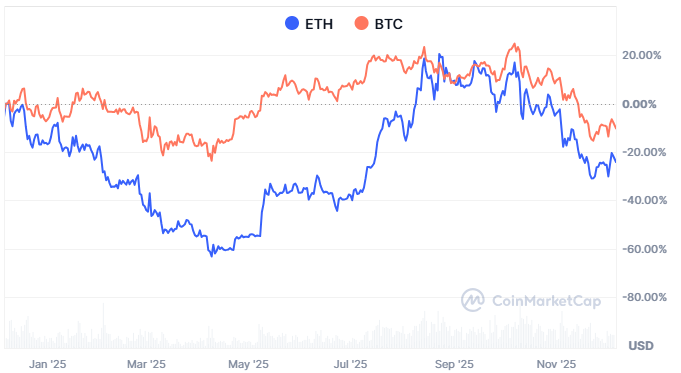
In late 2025, ETH dropped toward the -40% to -60% zone while BTC held firmer levels. Such extended relative weakness often forms the foundation for later reversals. Ethereum as of writing is trading near $3,038.11 with a market cap of $366.68B. Its circulating supply stands at 120.69 million ETH. Market participants now evaluate whether the current technical setup aligns with the earlier rotation phase.