
Key Insights:
- Dogecoin trades near multi-month lows as ETF inflows stall and futures open interest falls from five billion to one billion dollars.
- Weekly charts show a multi-year head and shoulders pattern, with price holding below key moving averages and major support levels.
- Weak institutional participation contrasts sharply with rising assets in XRP and Solana ETFs, highlighting shifting capital flows across crypto markets.
Dogecoin remained under pressure this week as weak institutional flows and falling derivatives activity reinforced its ongoing bear market structure. The token traded at 0.09610 dollars, marking an 80 percent decline from its November 2024 peak. Price action now hovers near levels last seen in September 2024.
Data from spot exchange traded funds tied to Dogecoin shows limited fresh capital entering the market. Products from Grayscale, 21Shares, and BitWise have recorded no inflows since early February. Monthly cumulative inflows stand at just 252000 dollars, while total assets remain near 9 million dollars.
In contrast, XRP focused funds have gathered more than 1 billion dollars in assets. Solana based products hold roughly 775 million dollars. Consequently, capital rotation appears to favor larger altcoins with stronger momentum.
Futures Market Activity Shrinks
Derivatives data adds to the cautious tone across the market. Futures open interest linked to Dogecoin has fallen to about 1 billion dollars from 5.2 billion dollars recorded in September last year. This steady decline reflects lower participation from leveraged traders.
Moreover, open interest has trended downward since the major liquidation event in October. Falling open interest during a broader price decline often signals weakening speculative demand. As a result, short term momentum remains limited.
Technical Pattern Signals Downside Risk
The weekly chart outlines a clear bearish structure. Dogecoin has dropped below the 0.10 dollar support level and continues to trade under its 50 week and 100 week exponential moving averages. These signals confirm sustained selling pressure.
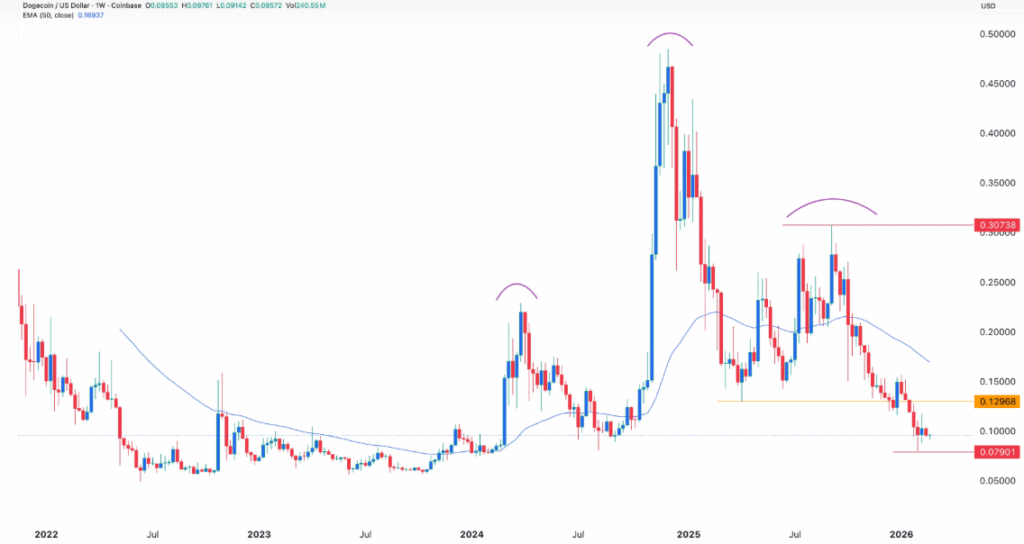
Significantly, price action has formed a large multi year head and shoulders pattern. The head stands at 0.4820 dollars, while the right shoulder formed near 0.3073 dollars and the left shoulder near 0.2290 dollars. The neckline break strengthens the broader downtrend.
Dogecoin also slipped below the 0.1296 dollar level, which marked its April low last year. This breakdown reinforces the bearish setup visible on higher time frames. Traders now monitor the 0.050 dollar area as the next major support.
However, a sustained move above 0.1300 dollars would weaken the current bearish outlook. Until then, technical and flow data continue to point toward cautious positioning across the Dogecoin market.