
- BNB maintains its broader breakout structure despite a corrective move toward the $800 area.
- Funding behavior shows shifting leverage cycles as traders adjust positions around consolidation zones.
- Historical expansion patterns support cycle projections toward $2,300 if structure remains intact.
BNB trades under pressure after a recent pullback, though higher-timeframe indicators continue to show a steady macro structure. Market data and funding behavior point to shifting sentiment as traders reassess positions during the current consolidation period.
BNB Breakout Structure and Cycle Projections
BNB continues to follow its broader breakout structure, supported by historical expansion cycles. Crypto Patel noted that the asset maintains a strong high-timeframe trend that has repeated across several market phases. Each cycle formed wide ranges before generating large expansions.
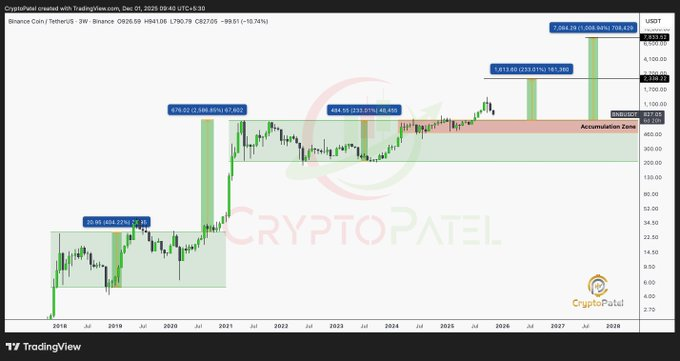
The chart shows that price spent years building two major structural bases. The 2018–2020 range produced a 400% move after breaking, while the 2021–2023 range produced another 233% leg. These expansions create the basis for the current cycle projections shown on the chart.
The latest consolidation zone formed between $200 and $700. BNB broke above this range in early 2025, establishing a fresh macro breakout. Current projections based on historical behavior point toward a potential run toward $2,300 during this cycle if the pattern continues.
Accumulation Zones and Market Pullback Dynamics
The chart also displays a defined accumulation band between $700 and $500. Patel described this area as a major discount zone for long-term positioning. This region aligns with the top of the previous multi-year structure and reflects prior cycle retest behavior.
BNB is now positioned around $822.61 after a corrective decline. Market data shows a 5.55% drop over the past 24 hours and a 2.52% decline across the week. Even with this move, the macro pattern remains intact and continues to resemble earlier cycle pullbacks.
Historical price behavior shows that BNB often returns toward major structural levels before expanding again. The current pullback fits within this behavior and keeps the broader trend intact. A deeper move toward the accumulation band would still maintain the long-term structure.
Funding Rate Shifts and Leverage Positioning
The BNB OI-Weighted Funding Rate chart reveals several rotations in sentiment from September to November. Funding flipped repeatedly between positive and negative readings, showing how long and short traders adjusted positions during the consolidation.
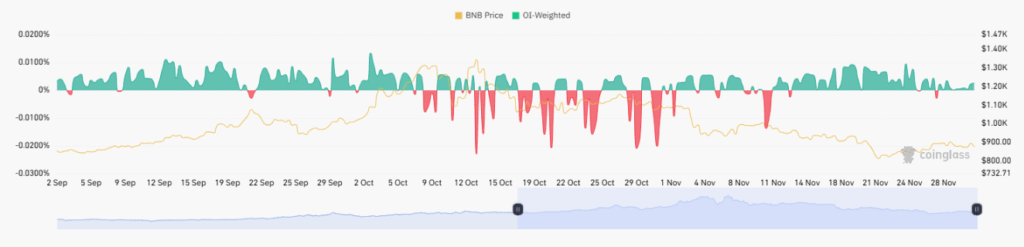
Early September saw mild positive funding as price held near the lower $900 area. Mid-September brought sharp negative spikes even as price attempted to break higher. This signaled cautious positioning from futures traders despite spot support.
October and November displayed rapid shifts between long and short bias. Price stayed between $950 and $1,050 as funding cycles tightened. By late November, both funding and volatility cooled as BNB drifted into the $800–$700 region, marking a period of de-risking while traders waited for a new trend.


