

- Bitcoin breaks $103K, but open interest lags, signaling reduced leveraged bets.
- Whale sentiment dropped sharply as BTC held highs, hinting at position shifts.
- October is top likely as fractal and SMA models flash cycle peak convergence.
Bitcoin has surged past $103,000 amid waning leverage and declining whale sentiment, signaling possible market repositioning. Recent data from Alphractal charts shows shifting sentiment patterns, lower open interest, and multi-cycle resistance alignments.
Open Interest Trails Behind Price Momentum
Bitcoin continues its bullish climb, yet open interest remains subdued compared to previous cycle highs. The aggregated derivatives open interest currently sits at $61.3 billion, below the $68 billion seen during past $103K levels. According to a post by Alphractal, this divergence reflects reduced leverage and market maker exposure following recent liquidation waves.
The correlation between price and open interest, evident across 2023–2025, remains strong but now shows fractures. Spot prices soared as open interest lagged, with whales reportedly entering short-term short positions. This decoupling could impact liquidity and volatility in the near term.
Whale sentiment, tracked hourly from March 30 to May 9, supports this view. Bitcoin rose from $75,000 to over $100,000 as sentiment surged to 1.0 before retreating. In a post by Alphractal, declining sentiment from May 4 to May 9 coincided with Bitcoin consolidating near recent highs.
Alphractal Model Predicts October 2025 Cycle Top
The current cycle pattern mirrors historical behavior from prior tops in 2013, 2017, and 2021. According to a report by João Wedson, the repetition fractal model expects a top to form between October 12–16, 2025. The model segments Bitcoin’s multi-year trajectory into accumulation, markup, distribution, and bear phases.
This ongoing fourth cycle began in late 2022 and has entered the advanced markup phase, according to the projection. The price has followed a similar fractal structure as earlier cycles, with tops forming near the upper resistance boundary. These models also incorporate short-term arcs within major waves to track intracycle behavior.
A separate development signals another turning point. The “Max Intersect SMA Model” chart places Bitcoin near historical top zones. The model shows resistance at the intersection of long-term highs and the Smart SMA, currently valued at $47,406.01. Red dots marking past tops now appear again, indicating peak alignment.
Industry analysts have also flagged notable concerns. Confidence metrics, ranging from 0 to 2, remain below prior top levels. Bitcoin trades around $70,000 on that index while confidence rests near 0.8, lower than previous market tops exceeding 1.5.
Sentiment, Derivatives, and On-Chain Data Align
Crypto Candy posted that the Bitcoin Fear & Greed Index reached 70 on May 10, 2025, indicating rising optimism. This sentiment level signals greed but not euphoric extremes, which typically appear above 75. The needle sits firmly in the green zone, consistent with historical pre-top conditions.
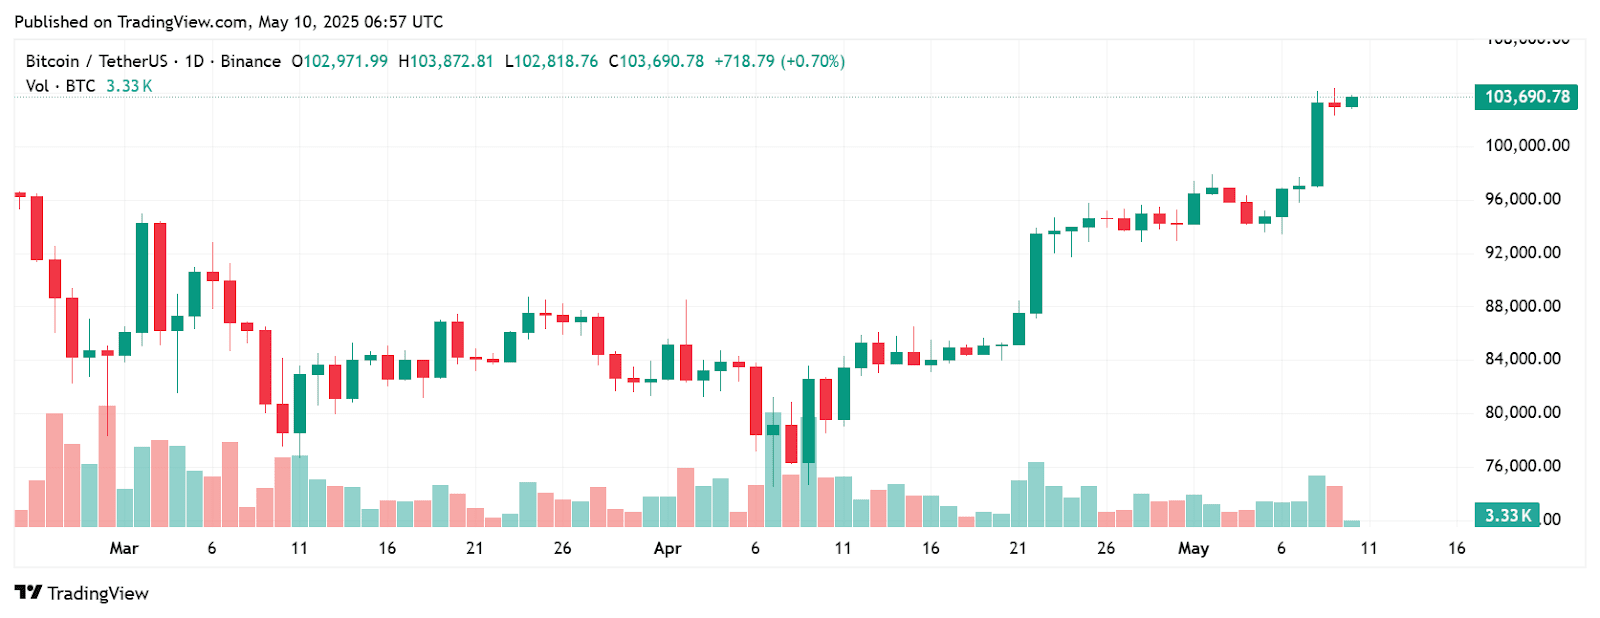
As of May 10, TradingView candlestick data shows Bitcoin’s price closing at $103,690.78 after reaching a daily high of $103,872.81. Volume reached 3.33K BTC, supporting the breakout above $100K with conviction. Multiple consolidation phases since March have built the base for this breakout.
These updates bring additional challenges for stakeholders navigating an overheated but fragmented market. Positioning now leans bullish, yet diverging metrics in leverage, sentiment, and historical top models present conflicting signals for traders and institutional desks.