
- Bitcoin shows a new support setup as RSI reaches its rebound zone with a hidden bullish divergence.
- The price holds above $90K after an 8% weekly gain while volume and structure remain steady.
- Funding metrics show fading long bias as negative prints emerge during late-November price weakness.
Bitcoin shows a developing market floor as momentum readings, price structure, and funding behavior move into alignment. Current conditions point toward a stabilization phase following weeks of corrective pressure and shifting sentiment in derivatives markets.
RSI Structure Signals a Developing Bottom
Bitcoin enters a constructive technical region on the 3-day timeframe as noted by Trader Tardigrade. The RSI goes back to its traditional support rebound area, an area that has supported previous cyclical turns. The indicator makes a lower low and price makes a higher low, with a hidden bullish divergence.
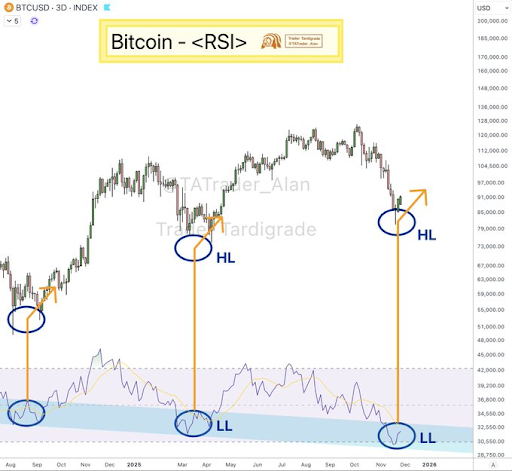
This divergence is a continuation of the trend and not the creation of the trend. Over the past year, each repeated visit to this zone produced renewed upside phases. The chart displays three such troughs, with each one occurring deeper on the RSI but higher on price, maintaining the broader uptrend.
The latest touch of this support region suggests the trend structure remains intact. The higher low formation continues to align with previous cycles. With RSI turning upward again, conditions point to early momentum regeneration despite recent corrective moves.
Short-Term Price Structure Holds Above $90K
Bitcoin trades at $90,578.06 after rising 8% in the past week. The asset builds a consistent series of higher highs and higher lows on the 7-day chart. The move began near $84K and extended above $88K as demand absorbed earlier weakness.
The weekly high reached $92,848 before a brief retreat. The pullback remains shallow, keeping the price above the $90K level. This is a behavior that indicates regulated trading environments where it is actively traded through buyers who assist in minor declines at intraday levels.
It has an estimated market capitalization of 1.808 trillion and circulating supply of 19.95 million BTC. The current involvement is confirmed by trading in the range of $57.17 billion. The structure shows steady upward movement without sharp reversals, maintaining a stable near-term trend.
Funding Rate Shows Position Reset After Earlier Excess
The volume-weighted funding chart from late August to late November captures a shift in derivatives positioning. Funding stayed positive for most of September and early October as Bitcoin traded between $100K and $130K. Long exposure dominated during this period, reflecting strong speculative confidence.
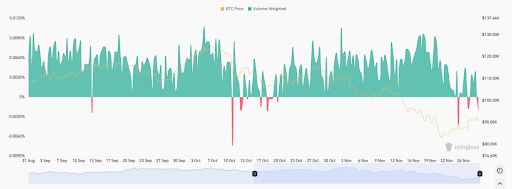
A notable shift arrived in mid-October with sharp negative prints, including a deep move near October 12. These events often track forced unwinding phases. After these readings, price softened and drifted lower through early November, falling below $100K.
Through November, funding oscillated around zero rather than collapsing. This suggested ongoing attempts to maintain long positions despite falling price. Near November 25–27, consecutive negative prints appeared as Bitcoin traded near multi-week lows in the mid-$90K zone. This pattern points toward early signs of reset as sentiment normalizes after months of long-side bias.