

- Short liquidations are piling up near $110K, signaling a possible squeeze.
- Exchange outflows hint at rising confidence as BTC nears key resistance.
- Leveraged longs dominate, but sharp reversals could trigger a cascade.
Bitcoin’s recent climb past $105,000 has coincided with mounting leverage and clustered liquidation risk on both sides of the market. Data from heatmaps, cumulative liquidation levels, and exchange flows indicate increasing pressure, particularly for short traders, as BTC approaches a key resistance zone between $108,000 and $115,000.
Heavily Leveraged Longs Drive Upward Momentum
Between May 8 and May 11, Bitcoin steadily advanced from below $600 million in liquidation levels to over $700 million. The price trajectory featured minimal deviation, consolidating briefly before a spike early on May 10. Heatmap data highlights dense, long liquidation zones between $95,000 and $105,000, where aggregated concentrations exceed $900 million. These yellow-orange clusters suggest significant leveraged long exposure awaiting validation or risk of reversal.
The cumulative liquidation chart confirms that long positioning has dominated since May 8. Long liquidations steadily climbed to $30 billion by May 11, while short liquidations remained under $20 billion. Green bars and accumulation zones in the lower $90,000 range, particularly around $91,000–$93,000, reveal prior liquidation absorption. Despite no major spikes below $90,000, rising green volume indicates sustained long pressure, implying upward continuation is still in play, barring sharp reversals.
Short Liquidation Clusters Build Near $110K
The liquidation map’s right-side histogram reveals that short liquidation interest now stacks heavily above $105,000, with peak density reaching $30 billion near $108,000. This zone, rich in red bars and high-risk clusters, reflects the pressure from leveraged short positions expecting a local top. The price’s recent test of this region on May 11 triggered cascading short liquidations that fueled a sharp move from $100,000 to $105,000.
Cumulative charts suggest shorts are vulnerable. The red curve representing short pressure remains flat, while the green long-side curve trends upward. With prices pushing into liquidation bands without retracement, aggressive short positions are increasingly at risk of being unwound. If BTC breaks above $110,000, an accelerated squeeze could follow, targeting the $115,000 level where $50 billion in short liquidations are clustered.
Exchange Outflows Confirm Market Confidence
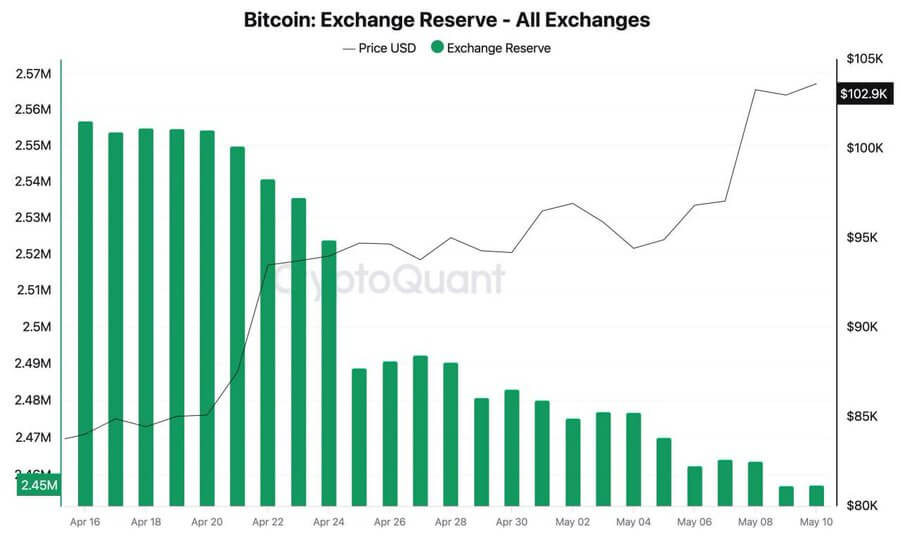
Data from April 16 to May 10 shows over 110,000 BTC withdrawn from exchanges, dropping reserves from 2.565 million to 2.445 million BTC. The inverse relationship between exchange balances and price became especially pronounced after April 24, as BTC climbed from $91,000 to over $102,000. The largest decline in exchange reserves, 80,000 BTC, occurred as the price broke out from $97,000 to $102,900 between May 4 and May 10.
This steady outflow underscores growing investor confidence and hints at reduced sell-side pressure. As supply tightens and liquidation risks mount for short traders, the technical outlook suggests BTC may challenge the $110,000 threshold. Whether long positions hold through potential volatility will determine if Bitcoin enters another leg higher or faces a leveraged unwind.
Bitcoin Price Action Reflects Volatility and Momentum Shift
From February to March, Bitcoin faced steep declines, testing critical support near the $84,000 range. Late March into April marked stabilization, with prices compressing between $86,000 and $92,000 levels. Rising volume and bullish candles in late April initiated a shift, pushing prices toward new highs.
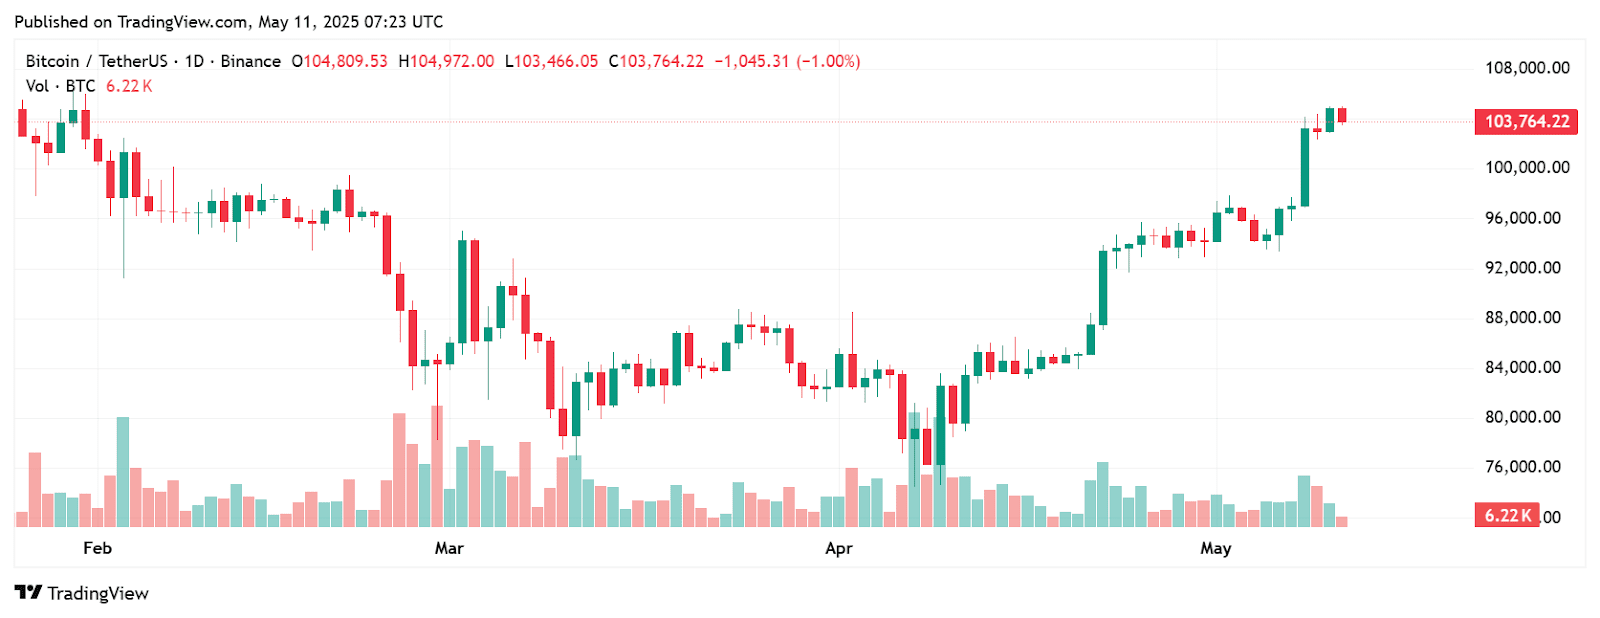
May started with a breakout over $100,000 due to robust buying power and high trading volumes. Prices oscillated between $102,000 and $105,000 with lower volatility from May 5 to May 10. On May 11, Bitcoin closed at $103,764.22 with a 1.00% daily loss and volume of 6.22K BTC.

