
- Bitcoin’s $84K resistance holds firm as traders position for a possible $96K breakout.
- BTC dipped below realized price bands, signaling market tension and cautious sentiment.
- Intraday swings near $83K show traders reacting quickly to tight price consolidation.
Bitcoin hovered around $83.70K on April 12, facing critical resistance at the $84K mark after recent volatility. Analysts are watching the $96K level as a potential breakout zone if bullish sentiment continues building.
Resistance and Realized Price Band Indicators
According to a post by Bitcoin Expert India, CryptoQuant data shows Bitcoin may stall at $84K if bulls lose control. The firm noted that breaking above $84K could push BTC toward the next resistance band, currently near $ 96 K. These price levels correspond to on-chain trader realized price bands calculated from six months of blockchain data.
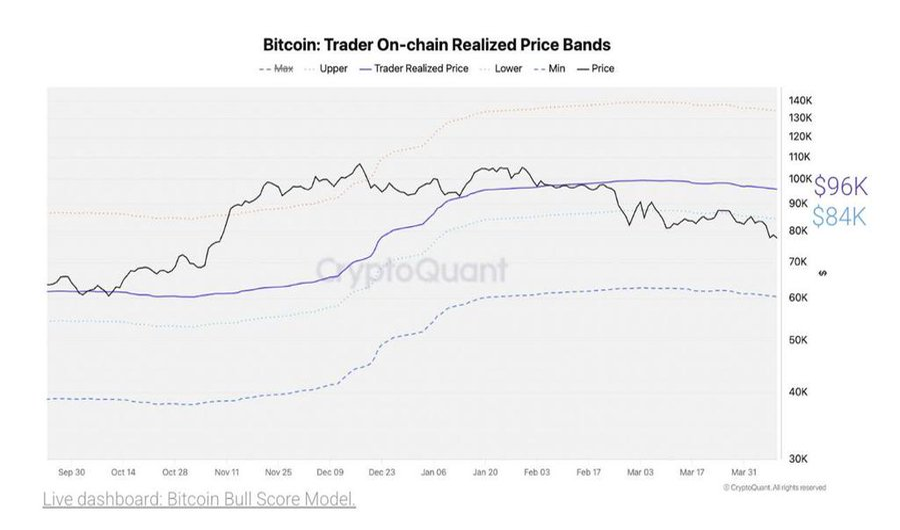
The chart shows five realized price bands: minimum, lower, trader realized price, upper, and maximum, spanning from September to March. Bitcoin moved between the lower and upper bands through Q4 2024 before declining in March. The price dropped below the trader’s realized price line in late February and continued downward toward the lower band.
The trader realized the price stands at $96K while the lower band rests at $84K as of March 31. The chart confirms the current BTC price near $83.70K remains under key realized cost metrics. The structure helps traders identify accumulation or distribution zones based on historical trader behavior.
April 12 Intraday Price Volatility
The reported intraday data from April 12 shows Bitcoin opened below $83.00K and fell steeply to under $81.50K before rebounding. The market then surged past $84.00K near 1:00 AM before experiencing a modest pullback into the $83.00K range. Price action remained volatile throughout the session, with two sharp declines and two strong recoveries.

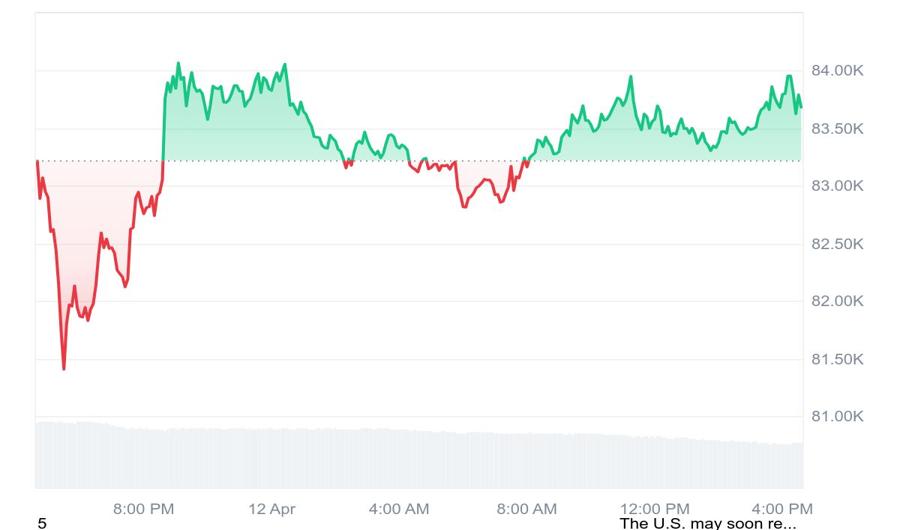
Bitcoin tested the $83.00K level several times, forming a short-term pivot point throughout the 24-hour window. The asset ended the session near $83.70K, posting a net gain over its opening level. Volume remained steady, showing consistent liquidity without major spikes during price shifts.
Key Technical Metrics and Market Positioning
Upper and lower realized bands began rising in October, peaked in January, then declined slightly through March. This movement indicates waning volatility and narrowing realized price ranges across traders’ aggregate cost basis. The maximum band remained over $120K while the minimum stayed below $50K throughout.
Bitcoin’s recent trade below the trader realized price reflects weakening short-term sentiment from market participants. BTC remains above the minimum band, showing resilience amid volatility. The current market price continues to track between the lower and minimum cost basis thresholds, offering critical context for trader positioning.