
- Bitcoin Cash Cycle Signals tracked previous peaks and bottoms through calibrated CVDD metrics across several cycles.
- Historical data shows fresh bottom signals remain absent until Bitcoin Cash trades below the $100 region.
- The latest model favors probability zones over certainty while emphasizing objective on-chain metrics.
Bitcoin Cash Cycle Signals indicate historical turning points remain intact, while current data suggests further downside remains possible before a new bear market floor appears.
Historical Model Captured Previous Market Extremes
A social media post from joao_wedson presented Bitcoin Cash’s long-term on-chain structure. The chart relied on Alphractal’s adjusted CVDD framework. Historical peaks and bottoms aligned with calibrated price zones.
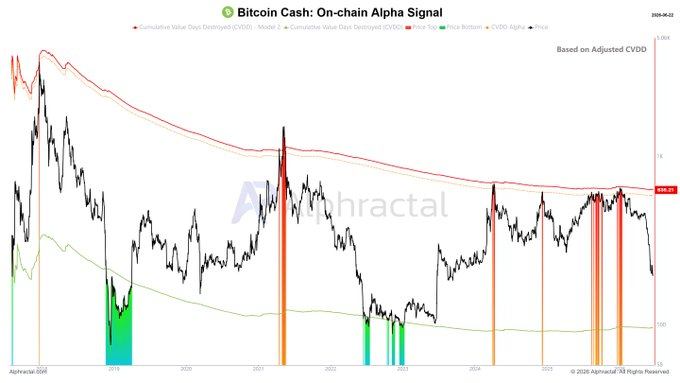
The black price curve tracked several cycles since Bitcoin Cash launched. Upper red bands marked overheated periods consistently. Lower green regions appeared during major capitulation phases.
Green markers emerged during the 2018 market decline. Similar readings appeared throughout the 2022 and 2023 downturn. Those periods later preceded notable recovery phases.
The tweet stated these metrics captured every major turning point. Data-driven approaches remained central to the framework. Market narratives arrived after objective signals appeared.
Current Structure Suggests Downside Risk Remains
Recent price weakness developed after extended consolidation below resistance. Bitcoin Cash currently trades above the lower support region. The model has not issued another bottom signal.
According to the posted chart, fresh signals remain distant. The lower boundary sits beneath current market levels. That area becomes relevant only below $100.

As of the time of writing, Bitcoin Cash prices imply nearly 50% downside potential. However, the model avoids certainty regarding future direction. Probability remains the foundation behind these readings.
The social media commentary stressed market unpredictability. No indicator guarantees a specific outcome. Historical patterns only provide reference zones for investors.
Sub-$100 Region Emerges as Key Area
The analysis suggested sub-$100 prices deserve attention. Historical evidence linked lower bands with cycle lows. Previous recoveries began after similar conditions emerged.
Orange markers also identified overheated periods during past rallies. Those signals appeared around major tops. Profit-taking increased following those extreme readings.
The 2021 advance offered another example from the chart. Price spikes aligned with upper resistance bands. Those levels later preceded substantial corrections.
The update emphasized objective data over market narratives. Alphractal’s tools seek clearer top and bottom zones. If Bitcoin Cash reaches sub-$100 territory, historical behavior favors accumulation interest.