

- Bitcoin’s breakout mirrors global M2 strength as both enter steep bullish channels.
- Phase 3 of the M2 cycle suggests Bitcoin may rise further before liquidity fades.
- Bitcoin tracks M2’s surge while the dollar weakens, pushing the price toward $170K.
Bitcoin’s price structure is once again tracking global money supply trends, with M2 strength reaching historic levels. As the U.S. dollar posts its weakest H1 since 1973, macro liquidity appears to be fueling crypto upside.

Bitcoin Price Mirrors Global M2 Breakout Structure
According to a post by Cointelegraph, Bitcoin trades at $106,972.15 after gaining 1.22%, while the Global M2 index prints 113.88. The synchronized price structure highlights a clear alignment between Bitcoin’s rallies and surging global liquidity. Both charts show two falling wedges, each followed by a breakout into steep vertical momentum.
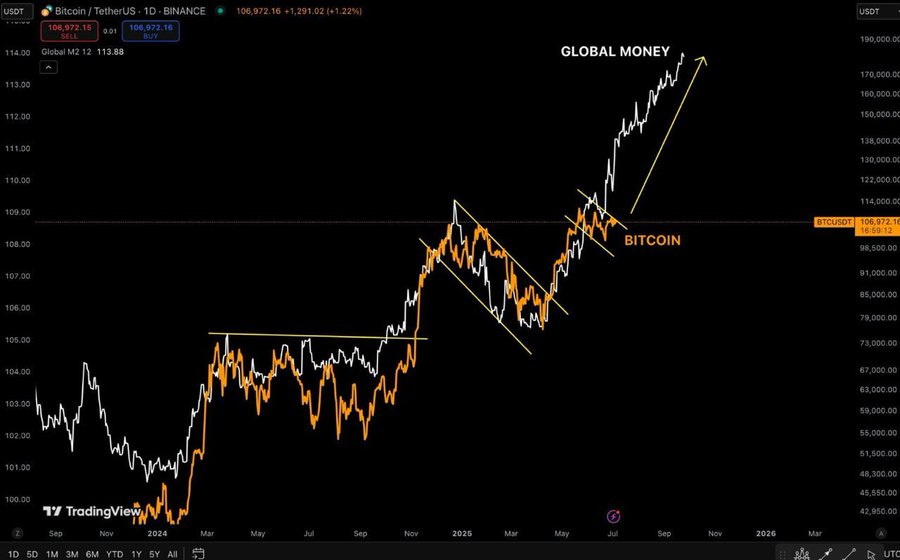
The second wedge breakout for Bitcoin mirrors Global M2’s sharp continuation rally, suggesting shared structural acceleration. Trendlines and breakout confirmations appear nearly identical, indicating technical harmony across both asset classes. This parallel move confirms that liquidity cycles are currently guiding Bitcoin’s price behavior.
Recent movements in the market have reshaped macro-crypto correlations as money supply becomes a leading driver. Bitcoin’s upward channel shows higher highs and steep support angles-identical to Global M2’s climb. Such structure confirms that this cycle remains liquidity-led, not speculative noise.
Phase 3 Injection Pushes Toward Parabolic Zone
According to a report by CryptoCon, Bitcoin is currently deep into Phase 3 of the M2 money cycle-defined as the final parabola. The “Global M2 Strength” chart outlines three injection stages: Phase 1 marks bear market bottoms, Phase 2 covers mid-cycle pushes, and Phase 3 triggers euphoric tops. Historical peaks in 2017 and 2021 also occurred during this red-shaded Phase 3 zone.
The latest cycle reveals that M2 strength has not yet reversed, meaning Bitcoin’s macro support remains intact. M2 continues to hover above the high global cash threshold, historically tied to breakout behavior. A red marker flags October 2025 as a potential exhaustion point-mirroring past cycle tops.
Therefore, this structure suggests Bitcoin could still rally further before liquidity begins to fade. The chart shows Bitcoin’s price historically peaks just after M2 strength tops out. This lag leaves a multi-month window for continued upside if macro conditions hold.
Macro Liquidity Push May Extend Crypto Momentum
Bitcoin’s tight relationship with M2 strength confirms a growing dependence on macro money flows. Each drawdown in M2 has previously led to cycle tops, while every rally phase pushed Bitcoin higher. With global M2 now at $55.48 trillion, the current breakout echoes patterns seen before major price surges.
Both Bitcoin and M2 sit inside steep upward channels, reflecting broad-based capital rotation into risk-on assets. The U.S. dollar’s weakness amplifies this setup, pushing traders to hedge with store-of-value alternatives. As long as M2 expands, Bitcoin could remain structurally supported in its march toward the $170K zone.