
- Algorand trades within a descending triangle, with pressure mounting near the $0.23 support level.
- Market data shows strong derivative participation, overshadowing spot demand for ALGO.
- ALGO records an 84.59% one-year gain but remains 92.61% below its all-time highs.
Algorand is trading in a downward triangle on the daily time frame indicating that the market is uncertain on which sellers limit rallies and buyers limit support. The trend indicates a squeezed out movement that is set to unravel into a decisive action in the near future.
Descending Triangle Pressures Price Structure
Alpha Crypto Signal (@alphacryptosign) noted that Algorand is consolidating between horizontal support and a descending trendline. The chart reveals a flat base near $0.23–$0.24 while lower highs continue to compress price action. This classic descending triangle often leans bearish.
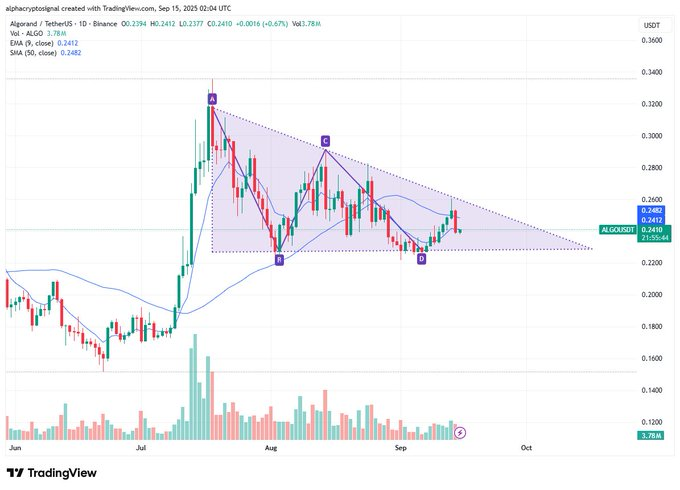
Since peaking near $0.34 in July, ALGO has failed to reclaim higher levels. Repeated rejections around $0.30 and subsequent minor peaks have defined the descending trendline. Meanwhile, the $0.23 zone has repeatedly absorbed selling pressure but shows signs of weakening as tests accumulate.
Volume analysis confirms waning conviction. As the structure develops, volume has thinned considerably, consistent with triangle formations. The latest rebound at $0.23 was not very strong implying that there was no extensive bullish belief without breaking above $0.26-0.27.
Market Data and Moving Averages Context
ALGO is trading at the time of writing at $0.2419 down by 2.51% per day and up by 4.07% per week. The volatility is captured in intraday motions where there are four-hour gains with general weakness.
Key moving averages show pressure zones. The 50-day simple moving average sits at $0.248, while the 9-day exponential moving average hovers near $0.242. Price is testing these levels, and daily closes below them may embolden sellers further.
Liquidity concentration is tilted toward derivatives. With spot volume at $21.76 million against futures trading at $136.07 million, speculative positioning dominates. Open interest at $135.29 million confirms heightened derivative engagement, which often accelerates volatility in critical ranges.
Performance Across Timeframes and Broader Outlook
ALGO’s one-year performance shows an 84.59% gain, rewarding long-term holders despite short-term declines. However, from an all-time perspective, the asset remains 92.61% below its peak. This long-term weakness tempers optimism from recent rebounds.
Shorter timeframes show mixed results. ALGO is up 5.0% in seven days, though 30-day performance remains down by 4.56%. Over longer windows, 90-day and 180-day returns stand positive at 37.51% and 29.93%, respectively.
For traders, the descending triangle serves as a roadmap. A lower break of less than $0.23 can cause the targets to reach $0.20-$0.18. Positively, a breakout would restructure and introduce recovery to $0.30-$0.32 on the upper side of the market at $0.27-$0.28.Until resolution, the range reflects compressed uncertainty with downside risk.


