
Key Insights:
- Solana tests the $88 support zone after a six-day decline, with price structure tightening as momentum weakens across key technical indicators.
- ETF outflows remain small but align with price weakness, while derivatives data show rising hedging activity and declining open interest among traders.
- RSI nears oversold levels as trendline support holds near $86, creating conditions that often precede short-term rebounds within established ranges.
Solana trades at $89.93, slightly lower on the day, as the price continues to retreat from the $98 peak reached on March 13. However, the recent six-day slide has pushed the asset back into a critical support range between $88 and $90.
Besides, this zone has acted as a reliable floor across multiple tests in February and early March, making the current revisit significant for short-term direction.
Daily Indicators Signal Weakening Momentum
The daily chart shows price failing to sustain momentum above the Bollinger Band midline at $95.11 following the recent rally. Consequently, resistance now forms between $93.94 and $95.11, where the 50-day EMA and midline converge.
Moreover, the 20-day EMA at $88.78 sits just below the current price, offering immediate support, while the lower Bollinger Band at $80.33 marks the next downside level if selling pressure intensifies.
Support Cluster Remains Under Pressure
All major exponential moving averages remain tightly grouped, reflecting a compressed structure that often precedes a larger move. However, a daily close below the 20-day EMA would weaken the recovery structure built since late February.
Hence, such a move would expose the lower volatility band near $80, reinforcing the importance of the current support region.
Short-Term Charts Highlight Critical Test
On the two-hour timeframe, price trades within a defined support zone between $86 and $88 as selling pressure slows. Additionally, the Parabolic SAR now sits above the price at $92.71, confirming a short-term bearish shift.
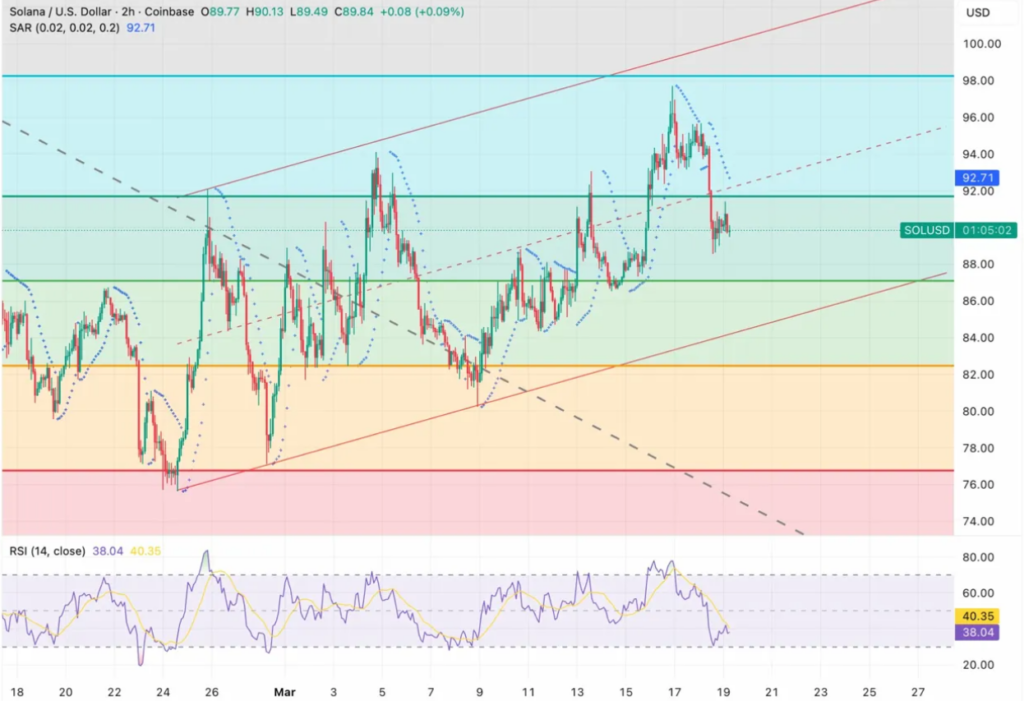
RSI reads near 38, approaching oversold conditions, which historically aligns with bounce attempts when price tests established support zones.
Trendline Support Adds Confluence
The ascending trendline from February lows remains intact near $86 to $87, adding structural support to the horizontal zone. Significantly, this confluence strengthens the likelihood of short-term stabilization if buyers defend the area.
However, a break below $86 would invalidate this setup and shift focus toward the $82 to $84 range as the next demand zone.
US-listed Solana spot ETFs recorded net outflows of $295.73K on March 18, ending an extended streak of inflows. Moreover, the movement came solely from one fund, while others reported no activity.
Despite the modest size, the shift coincides with price weakness, drawing attention from traders monitoring directional cues.
Derivatives Data Reflect Hedging Activity
Open interest declined by 6.77% while trading volume rose slightly, indicating reduced directional exposure. Meanwhile, options volume surged sharply, signaling increased hedging activity among market participants.
Long liquidations exceeded short liquidations, confirming that recent price action forced leveraged bullish positions out of the market.