Key Insights
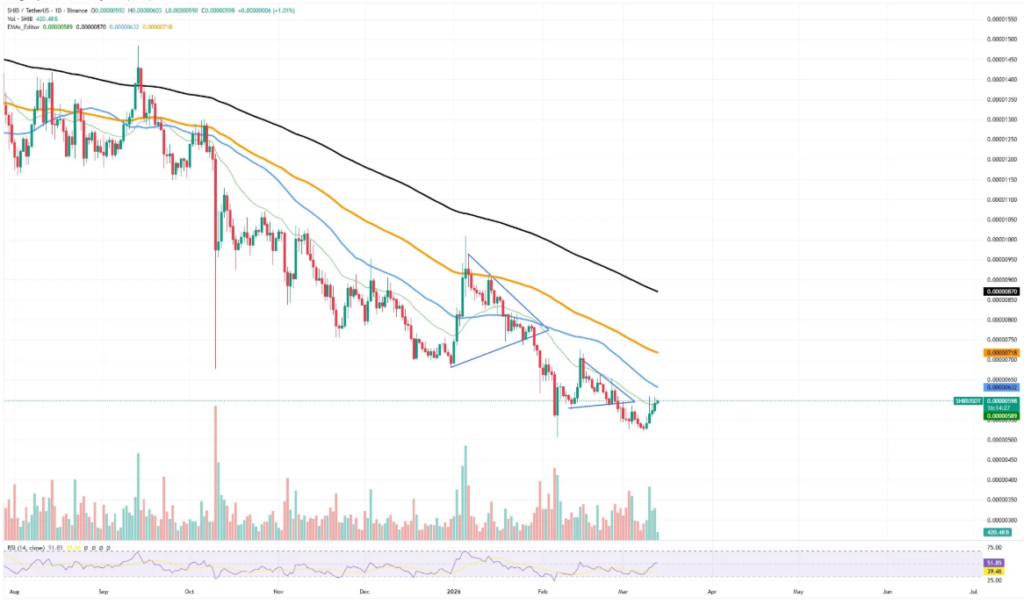
- Shiba Inu price climbed toward $0.0000060 after breaking out of a descending triangle pattern, supported by an increase in market participation and trading activity.
- Around 1.75 trillion SHIB tokens were traded during the breakout, signaling stronger liquidity and increased trader engagement during the recovery phase.
- The breakout pushed SHIB above local resistance, allowing the token to stabilize near recent highs as traders closely monitor nearby resistance zones.
Shiba Inu has recorded a short-term price breakout after months of steady weakness in the broader market. The token moved higher after prolonged selling pressure pushed the asset into a persistent downtrend during recent weeks. Consequently, the latest price movement has drawn attention as market activity increased sharply during the breakout.
The token currently trades near $0.0000060 after recovering from recent lows. Besides the price improvement, traders have noted the sudden surge in trading activity that supported the move above local resistance levels.
Strong Volume Supports Market Activity
Around 1.75 trillion SHIB tokens changed hands during the breakout period, marking a significant increase compared with the previous consolidation phase. Significantly, this surge in activity indicates broader market participation rather than isolated speculative trades.
Higher trading volume often supports price stability during breakout attempts. Moreover, the surge suggests that traders actively entered the market, with some opening long positions while others closed short trades.
Technical Pattern Breaks After Consolidation
The breakout followed the formation of a descending triangle that limited price movement for several sessions. However, buyers stepped in quickly once the price crossed the upper boundary of the pattern. Consequently, this buying pressure pushed the token into a brief upward move.

Such patterns often signal a change in short-term momentum when price breaks above resistance. Additionally, the move shows that traders reacted immediately once the technical barrier no longer held.
Recovery Faces Important Resistance Levels
Despite the improvement in price action, Shiba Inu remains below several key moving averages that previously acted as dynamic resistance levels. These indicators continue to define the broader market structure after months of declining prices.
Moreover, the token must regain these levels before analysts confirm a sustained recovery trend. Consequently, traders continue to monitor whether the asset can maintain momentum above the breakout zone.
Market Activity Suggests Shift in Sentiment
The surge in trading activity reflects renewed engagement from market participants following a period of weak confidence. Additionally, increased liquidity may help stabilize price fluctuations in the short term as more traders participate in the market.
Besides the immediate rally, the breakout may allow Shiba Inu to attempt moves toward nearby resistance zones. Consequently, the market could shift toward a broader consolidation phase if buying pressure continues to hold above the newly formed support area.