
Key Insights
- XRP trades between $1.32 and $1.46 as Bollinger Bands tighten sharply, signaling a potential volatility expansion similar to January’s rally.
- Key macroeconomic events including the March CPI report and upcoming Federal Reserve meeting could act as triggers for XRP’s next major move.
- Technical indicators show neutral momentum while price stays near the mid Bollinger line, leaving room for a breakout toward $1.60 or decline.
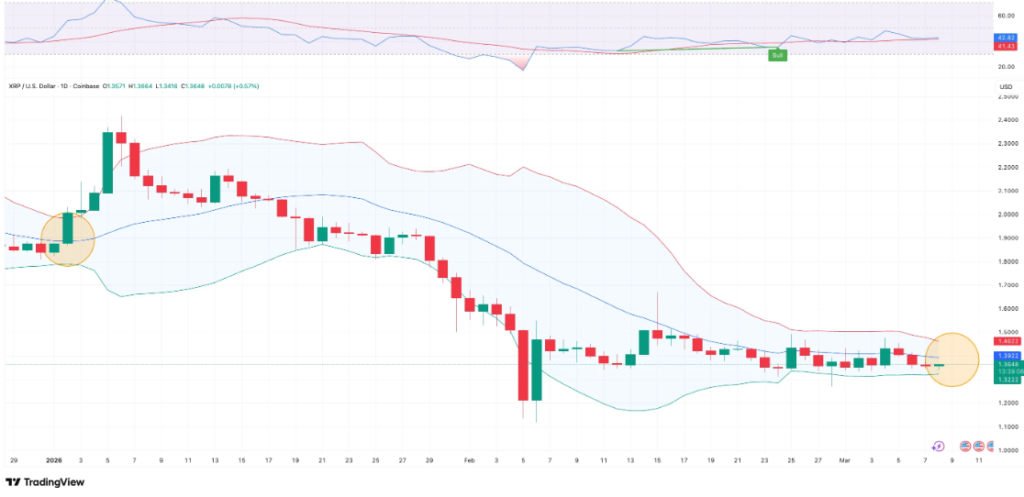
XRP has entered a phase of unusually low volatility as Bollinger Bands on the daily chart compress sharply. Market data shows the asset trading inside a narrow range between $1.32 and $1.46 through early March. Such compression often appears before periods of stronger price movement in digital assets.
Traders monitor this technical pattern closely because tighter bands reflect declining volatility. Besides signaling quiet trading conditions, the pattern often precedes a rapid expansion in price activity. Market participants now watch the chart for signs of a breakout beyond the current range.
The current structure places XRP near the middle Bollinger Band, which often acts as a short-term directional signal. Consolidation above that midpoint typically supports a bullish trend. However, sustained trading below it usually indicates rising downside pressure.
Recent price action shows XRP fluctuating around this middle level without clear direction. Consequently, both bullish and bearish scenarios remain possible in the near term. Traders continue to track whether the asset holds above the midpoint or slides below it during upcoming sessions.
January Rally Highlights Impact of Similar Pattern
A comparable compression appeared earlier this year before XRP experienced a rapid upward move. During that period, the price surged more than 25 percent after volatility expanded suddenly. The similarity between the two patterns has increased attention among market observers.

However, a squeeze alone does not determine direction. Technical analysts stress that the breakout could occur either upward or downward depending on market catalysts. Hence the focus has shifted toward upcoming economic events that may influence sentiment across digital assets.
CPI and Federal Reserve Events Approach
The timing of the current volatility compression coincides with major macroeconomic releases. The United States Consumer Price Index report scheduled for March 11 may shape expectations around inflation and monetary policy. Additionally, the Federal Reserve will hold its policy meeting on March 17 and 18.
These events often trigger volatility in both traditional and digital markets. Consequently, traders expect activity in the crypto sector to increase once new economic signals emerge. XRP may respond quickly as liquidity returns to the market.
Indicators Show Neutral Market Momentum
Momentum indicators currently support the neutral market structure. The Relative Strength Index remains in the middle zone, showing that XRP is neither overbought nor oversold. This reading suggests the market still holds room for a strong directional move.
Technical levels provide clear reference points for traders. A bullish breakout could push the price toward the $1.60 area. Conversely, a downside move may direct attention toward support between $1.10 and $1.20.