
Key Insights
- MANTRA price trades in a narrow range near $0.018 support as weakening bearish momentum signals potential consolidation after months of persistent decline.
- Technical indicators show extremely weak trend strength with ADX near 11 while resistance between $0.029 and $0.030 limits short-term recovery attempts.
- The v7.0.0 mainnet upgrade introduced a token rebrand and one-to-four split while circulating supply reached 4.76 billion tokens across markets.
MANTRA has moved into a narrow consolidation range after months of steady decline. Market data shows the token trading close to major support levels while technical indicators signal fading bearish pressure.
The price structure reflects a prolonged downtrend that started in September. Lower highs and lower lows continue to define the broader market trend.
However, recent trading activity shows the pace of selling has slowed. Consequently, the market now shows early signs of stabilization as price compresses near important support zones.
Weak Trend Strength Signals Sideways Market
Technical indicators show limited momentum across the market. The Average Directional Index remains close to 11, which signals very weak trend strength.
Markets with an ADX below 20 often shift into consolidation instead of strong directional moves. Hence, MANTRA currently trades in conditions that usually precede sideways price action.
Additionally, the Supertrend indicator continues to show a bearish structure. However, weakening momentum suggests that sellers may be losing some control in the short term.
Support Zones Attract Buyer Interest
Key support levels have formed between $0.018 and $0.020 where buyers recently defended price declines. This area now acts as the immediate base for the ongoing consolidation phase.
If this support continues to hold, the market could attempt a short-term recovery. Consequently, traders now watch whether buyers can build momentum toward higher resistance levels.
Below this range, stronger demand sits near $0.0099 to $0.010. This level aligns with a major historical rebound zone and the Fibonacci retracement baseline.

Resistance Levels Shape Recovery Path
Resistance remains clearly visible above the current price. The immediate barrier appears between $0.029 and $0.030 where previous rejections occurred.
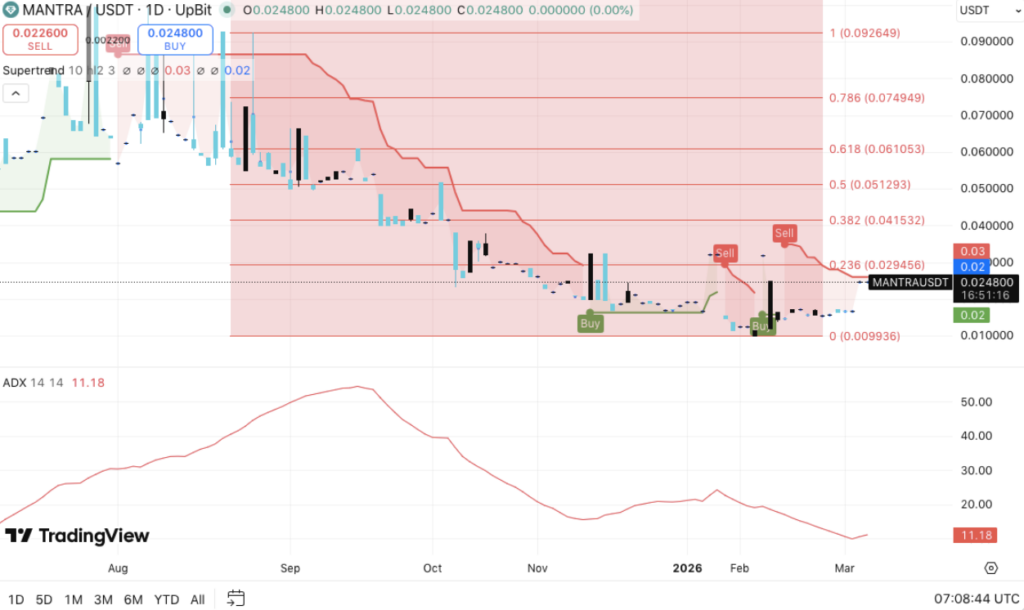
This level also aligns with the Fibonacci 0.236 retracement level. Hence, a breakout above this zone could trigger renewed bullish momentum.
Further resistance stands near $0.041 and $0.051. These levels correspond with the 0.382 and 0.5 Fibonacci retracement levels that define the next recovery targets.
Mainnet Upgrade Draws Market Attention
Network developments have also renewed interest in the project. The platform recently activated its v7.0.0 mainnet upgrade at block height 13,000,000.
The update introduced structural changes across the ecosystem. Significantly, the project replaced the OM ticker and adopted the MANTRA token name to strengthen its identity.
Additionally, the network executed a one-to-four non-dilutive token split. This mechanism increased holder balances without expanding the maximum token supply.
Circulating Supply Supports Liquidity
Token distribution data shows that 4.76 billion tokens currently circulate in the market. This figure represents about 67.5% of the available supply.
Moreover, this level of circulation allows stronger participation across exchanges and decentralized platforms. Consequently, analysts expect improved liquidity conditions for trading activity.
Market participants continue to monitor support at $0.018 to $0.020 and resistance near $0.030 as the consolidation phase unfolds.