
- HYPE trades near a structural pivot as revenue strength shapes expectations for its next cycle move.
- A projected path shows zone-to-zone rotation as traders watch for a confirmed cycle low.
- Revenue data places HYPE among top-performing chains, supporting interest around current levels.
HYPE trades near a crucial structural level as traders examine its recent correction and the mapped trajectory for the next cycle. Market participants are watching for stability around current support before the asset attempts to reclaim higher value zones.
Projected Structural Framework for HYPE
The analysis shared by Johnny (@CryptoGodJohn) presents a structured map for HYPE over the next 12–16 months. His chart uses historical supply and demand zones to outline a potential recovery path. The current price forms the central pivot within this projection.
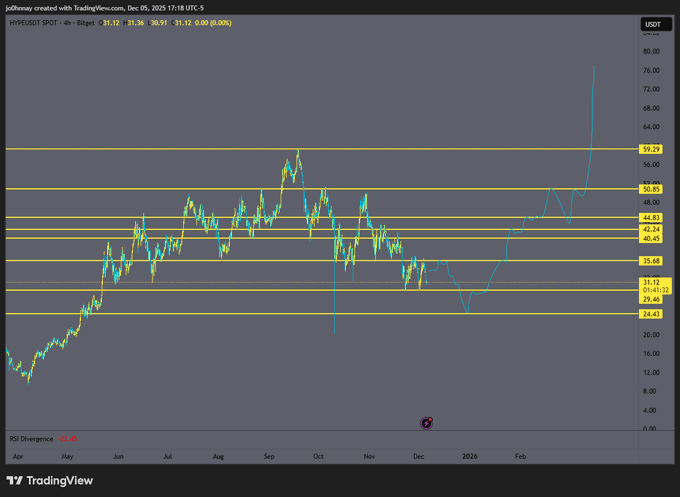
HYPE trades around $30.83, placing it near an inflection zone that acted as prior support. Beneath this area sits $29.46 and the deeper $24.43 zone, which served as a base during earlier expansions. It is projected that it will revisit the mid-range of the 20s in the short run, then build a cycle low.
The above sequence that has been plotted up to the current levels is in the following order; $35.68, $40.62, $44.83, $50.65 and $59.29.These levels reflect former high-volume trading zones. The structured climb indicates rotation through each range as momentum rebuilds rather than a direct vertical advance.
Market Performance and Revenue Strength
As of writing, data shows HYPE posting an all-time gain of 863% while recording a modest dip in market cap. The market value of the asset is $10.38B and a circulating supply of 336.68M HYPE. Such liquidity means that it is stable in the times of active trade.
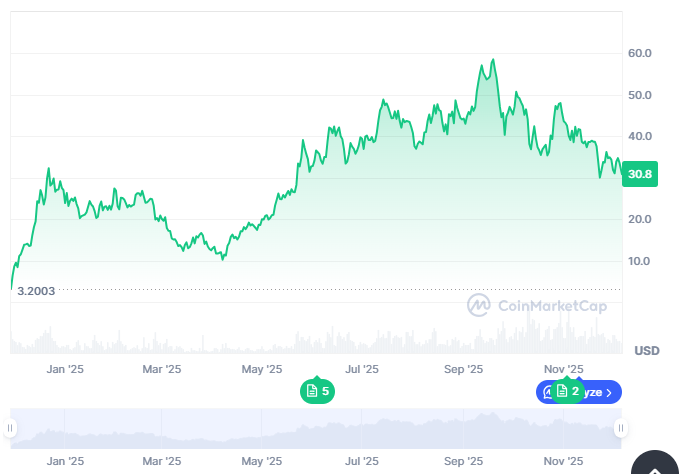
The chart displays a strong macro trend that started near $3.20 early in 2025. The price reached the $55–60 region before entering a controlled correction toward the $28–32 cluster. The slope of the retracement indicates a measured cooldown after an extended rally.
A post from CryptoFlex0 notes that HYPE generated $2.47M in revenue over 24 hours. This placed the asset second behind Solana. This revenue signal has supported interest as traders evaluate whether the asset is forming a mid-cycle consolidation.
Momentum Signals and Long-Range Breakout Zones
Johnny’s chart includes an RSI Divergence near current support. This suggests weakening downside momentum. Such signals often appear when price approaches a potential base, aligning with the projected cycle low.
Above the $59 level, the projection shows a sharp continuation toward higher ranges. This reflects a zone with limited historical resistance. When assets clear such levels, the price often moves efficiently due to reduced overhead supply.
The long-range path shows three phases: forming a structural low, reclaiming historical supply zones, and accelerating once the major resistance band is cleared. This layout builds its structure from observed historical movement patterns rather than speculative expectations.


