
- $PENGU records a -9.12% daily loss, showing continued market pressure and cautious sentiment.
- The TD Sequential “9” buy signal suggests potential trend exhaustion on the 3-day chart.
- Top traders increase long exposure, hinting at possible accumulation near key support zones.
After a prolonged selloff, $PENGU appears to be testing a critical support region as traders analyze whether the latest TD Sequential “9” buy signal could mark the start of a recovery phase or a temporary pause in bearish momentum.
TD Sequential Indicator Signals Potential Exhaustion
The TD Sequential indicator has flashed a “9” buy setup for $PENGU, suggesting potential exhaustion in the ongoing downtrend. After a persistent decline from early August, the asset has seen a steep fall from $0.06 to near $0.016. This signal often appears when market conditions reach points of saturation, providing early signs that the existing bearish momentum may slow.
Analyst Ali (@ali_charts) noted that this 3-day TD Sequential count could indicate a short-term reversal zone. Historically, this setup tends to occur near market bottoms, often preceding short-lived relief rallies or consolidation phases. The candles have indicated decreasing ranges, which is an indication of lack of selling aggressiveness.
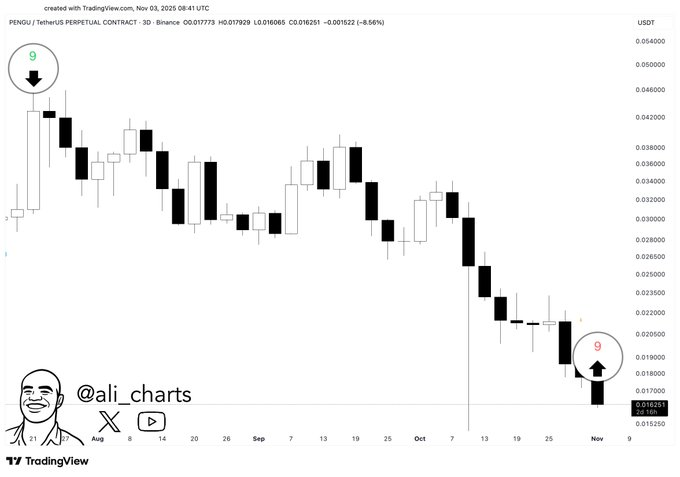
The traders will expect a reverse to the higher levels of resistance at $0.023 and in the range of $0.028, as long as $PENGU is within the range of between $0.016 and 0.018.Sustained volume above these marks could confirm a recovery phase. However, if price action slips below $0.0155, bearish continuation toward $0.012 may follow.
Traders Remain Divided Amid High Volatility
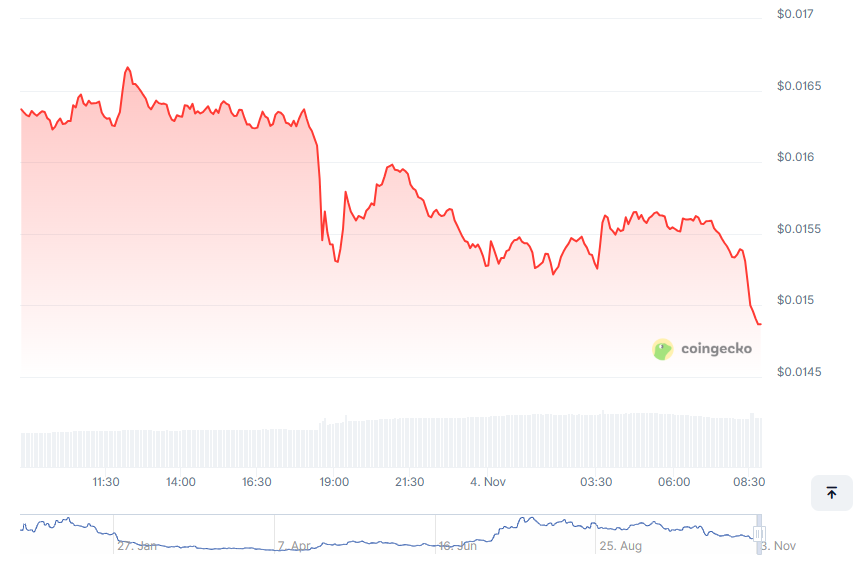
Market sentiment is still wary, in spite of the technical buy signal. The price of the final day, which is denoted by PENGU, decreases by 9.12% to around $0.01488, and the trading volume is $221956550. This trend continues the 7 days downward trend that has been nearly 30 percent, which indicates pressure on sales persists.
CoinGlass data reveals mixed positioning among traders. On Binance, the long/short ratio by accounts stands at $0.6926, reflecting bearish leaning among retail traders. In contrast, the top trader long/short ratio is 1.4081, suggesting that professional traders are positioning for potential rebounds near current lows.
Volatility continues to drive liquidations across exchanges. In the recent past, short and long positions worth $118K and $103K respectively were liquidated in the past few hours. The 24-hour liquidation sum was in excess of 1.6 million dollars, outlining the agile positing and rapid switching of mood in sharp intraday swings.
Market Structure Demonstrates a Weakness with an indication of stabilization.
The intraday chart shows that the prices dropped by $0.0164 to $0.0149, which proves that the pressure did not ease despite the TD Sequential signal. Nevertheless, the compression between highs and lows is an indication that buyers are trying to stabilize major areas of support.
Broader data reflects $PENGU’s ongoing struggle. The token has dropped 50.92% over 30 days and 55.41% year-to-date. Despite this, its one-year growth of 197.38% shows that long-term investors still hold considerable gains. The market now faces a test of whether current levels represent accumulation or continued distribution.
While immediate sentiment remains defensive, increasing long exposure by experienced traders could indicate growing confidence in a technical rebound. If short-term support levels hold, this phase might transition into a consolidation stage before further direction is established.


